How To Make Histogram with Median Line using Altair in Python?
Last Updated :
26 Nov, 2020
In this article, we will learn about how to make the histogram with the median line using Altair in python. This article is also a great example of Altair’s grammar of graphics.
Altair is one of the latest interactive data visualizations library in python. Altair is based on vega and vegalite- A grammar of interactive graphics. Here we will use the import keyword to use Altair library for using it.
Illustrate a Histogram with Median Line
First, we will load the packages of python that are used to make a histogram with a mean and median line using Altair.
Python3
import altair as alt
import numpy as np
import pandas as pd
|
Now we will generate the data to make a histogram with the median line. Here, we will use Numpy to generate random numbers from a normal distribution and create panda data frames.
Python3
np.random.seed(42)
df = pd.DataFrame({'height': np.random.normal(150, 10, 1000)})
|
Basically here we tend to build the bar chart with the median line which can produce two layers of double star image object and combine them. Using Altair’s chart function, we create the base plot of the data frames of data.
Now we use Altair’s mark_bar() function and create the base object to make a histogram. Also, here we mention which variable we are interested to make a histogram.
Python3
hist = base.mark_bar().encode(
x=alt.X('height:Q', bin=alt.BinParams(), axis=None), y='count()')
|
Using mark_rule() function in the Altair library, we use the base object with the data again to create a median line.
Python3
median_line = base.mark_rule().encode(
x=alt.X('mean(height):Q', title='Height'), size=alt.value(5))
|
Now to form the fundamental histogram with the median line we have a tendency to merely combine the bar graph object and median line object as follows:
Output:
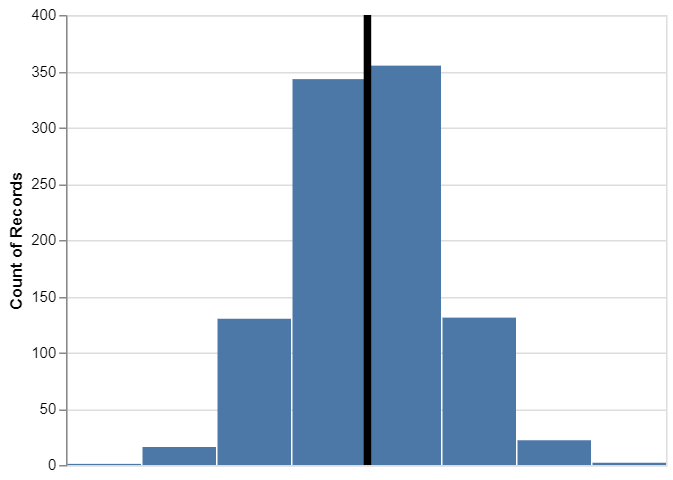
Therefore, here we get the histogram with the median line using Altair in python.
Let us now understand to get the Customized histogram.
Customizing Histogram with Median Line using Altair
In the basic histogram with the median line, Altair library uses the default parameters to plot the histogram. Like, Altair has chosen a blue color for the histogram and the number of bins for us. Similarly, Altair chose the black color for the median line. But we can easily customize the histogram with the median line using Altair.
First, we will increase the number of bins in the histogram, and then we will change the color of the median line to red.
We will use maxbins=100 argument within the coordinate axis parameter, to form the histogram with 100 bins. Then we can change the color of the median line to red using color=red inside mark_rule() function. And lastly, let us combine both histogram and median line object. And then we will improve the version of the histogram with a median line in Altair.
Python3
import altair as alt
import numpy as np
import pandas as pd
np.random.seed(42)
df = pd.DataFrame({'height': np.random.normal(150, 10, 1000)})
base = alt.Chart(df)
hist = base.mark_bar().encode(
x=alt.X('height:Q', bin=alt.BinParams(maxbins=100), axis=None), y='count()')
red_median_line = base.mark_rule(color='red').encode(
x=alt.X('mean(height):Q', title='Height'), size=alt.value(5))
hist+red_median_line
|
Output:
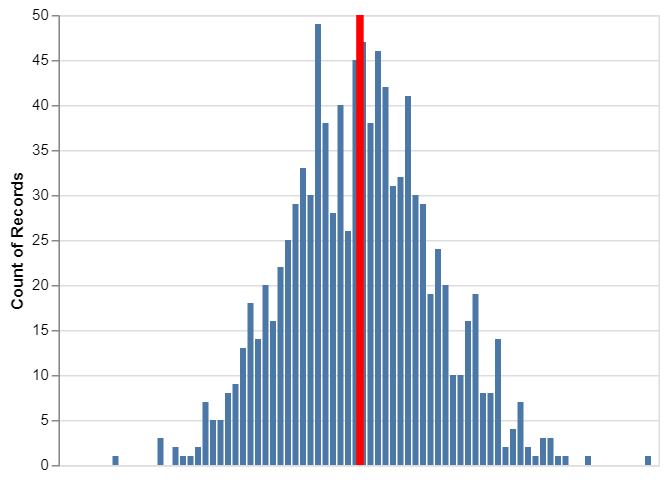
Therefore, the above figure shows the histogram with 100 bins and a red median line using Altair in python.
Share your thoughts in the comments
Please Login to comment...