How to Display Multiple Images in One Figure Correctly in Matplotlib?
Last Updated :
02 Feb, 2021
The easiest way to display multiple images in one figure is use figure(), add_subplot(), and imshow() methods of Matplotlib. The approach which is used to follow is first initiating fig object by calling fig=plt.figure() and then add an axes object to the fig by calling add_subplot() method. Then will display the image using imshow() method.
Syntax: add_subplot(rows, columns, i)
Here rows and columns are the total number of rows and columns in the figure and i is the position at which new subplot must be placed.
Steps:
- Import required libraries
- Create a figure
- Set values of rows and column variables
- Read images
- Add subplot and display image one by one
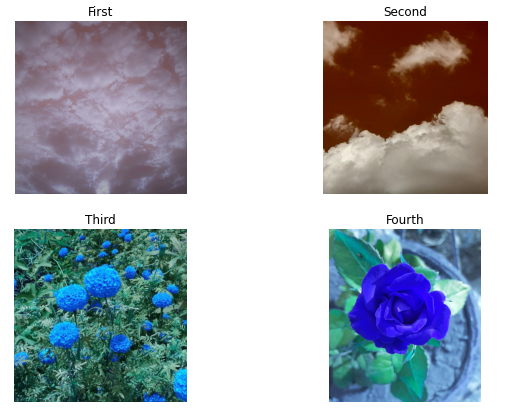
Consider below Images used as input:

Image1

Image2

Image3

Image4
Below is the implementation :
Python3
import cv2
from matplotlib import pyplot as plt
fig = plt.figure(figsize=(10, 7))
rows = 2
columns = 2
Image1 = cv2.imread('Image1.jpg')
Image2 = cv2.imread('Image2.jpg')
Image3 = cv2.imread('Image3.jpg')
Image4 = cv2.imread('Image4.jpg')
fig.add_subplot(rows, columns, 1)
plt.imshow(Image1)
plt.axis('off')
plt.title("First")
fig.add_subplot(rows, columns, 2)
plt.imshow(Image2)
plt.axis('off')
plt.title("Second")
fig.add_subplot(rows, columns, 3)
plt.imshow(Image3)
plt.axis('off')
plt.title("Third")
fig.add_subplot(rows, columns, 4)
plt.imshow(Image4)
plt.axis('off')
plt.title("Fourth")
|
Output:
Share your thoughts in the comments
Please Login to comment...