How to Change Point to Comma in Matplotlib Graphics in Python
Last Updated :
21 Mar, 2024
We are given a Matplotlib Graph and our task is to change the point to a comma in Matplotlib Graphics such that there is only a comma in the whole graph instead of a point. In this article, we will see how we can change the point to comma in Matplotlib Graphics in Python.
Change Point to Comma in Matplotlib Graphics in Python
Below are some of the ways by which we can change the point to a comma in Matplotlib graphics in Python:
- Using String Replace in Tick Labels
- Using Custom Tick Formatter
Using String Replace in Tick Labels
In this example, a simple line plot is created using Matplotlib, representing data points with purple lines. The x and y-axis tick labels are customized to replace decimal points with commas for improved readability.
Python3
import matplotlib.pyplot as plt

# Example data
x = [1, 2, 3, 4, 5]
y = [2.5, 1.5, 3.5, 2.0, 4.5]

# Plot
plt.plot(x, y, 'purple')
plt.xlabel('X-axis')
plt.ylabel('Y-axis')
plt.title('Example Plot')
plt.grid(True)

# Replace points with commas in tick labels
plt.xticks([tick for tick in plt.xticks()[0]], [
           str(tick).replace('.', ',') for tick in plt.xticks()[0]])
plt.yticks([tick for tick in plt.yticks()[0]], [
           str(tick).replace('.', ',') for tick in plt.yticks()[0]])

plt.show()
Output:
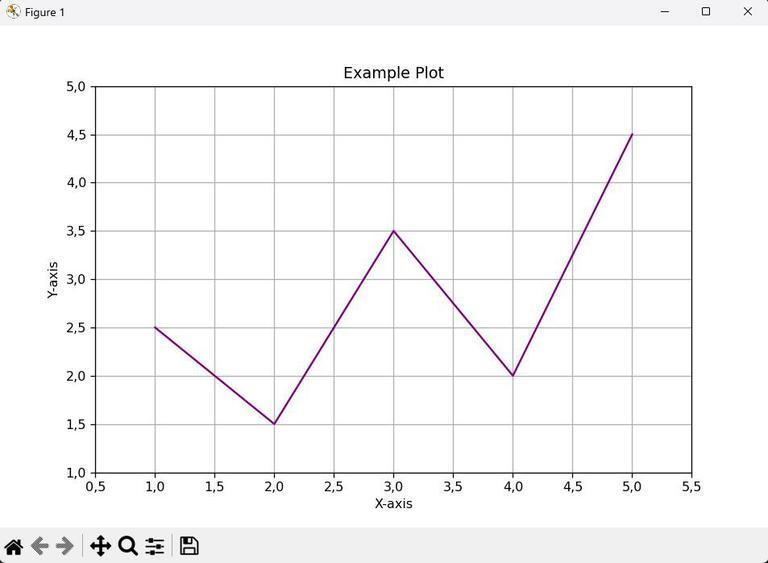
Use String Replace
Using Custom Tick Formatter
In this example, a line plot is generated using Matplotlib with gold-colored lines. The x and y-axis tick labels are formatted to replace decimal points with commas for enhanced visual presentation, achieved by defining a custom formatting function using FuncFormatter.
Python3
import matplotlib.pyplot as plt
from matplotlib.ticker import FuncFormatter

# Example data
x = [1, 2, 3, 4, 5]
y = [2.5, 1.5, 3.5, 2.0, 4.5]

# Plot
plt.plot(x, y, 'gold')
plt.xlabel('X-axis')
plt.ylabel('Y-axis')
plt.title('Example Plot')
plt.grid(True)


def comma_formatter(x, pos):
    return str(x).replace('.', ',')


plt.gca().xaxis.set_major_formatter(FuncFormatter(comma_formatter))
plt.gca().yaxis.set_major_formatter(FuncFormatter(comma_formatter))

plt.show()
Output:
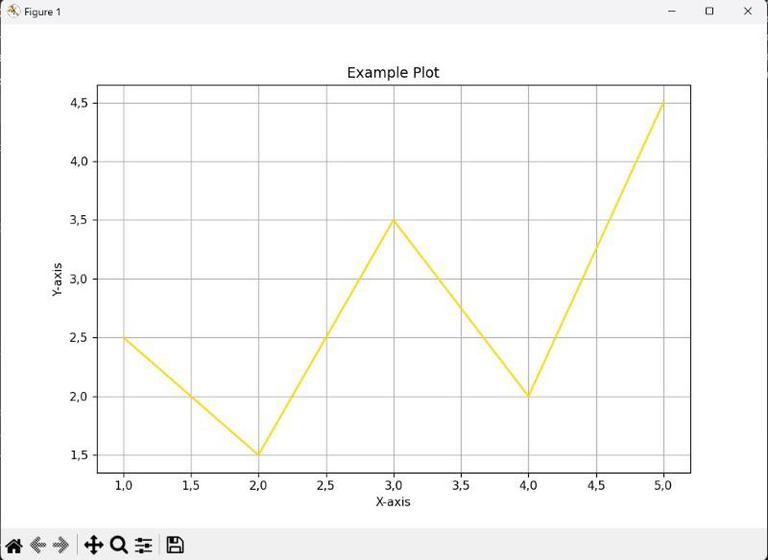
By Custom Tick Formatter
Share your thoughts in the comments
Please Login to comment...