Hide legend entries in a plotly figure in Python
Last Updated :
22 Nov, 2021
In this article, we are going to see how to hide legend entries in a plotly figure using Python.
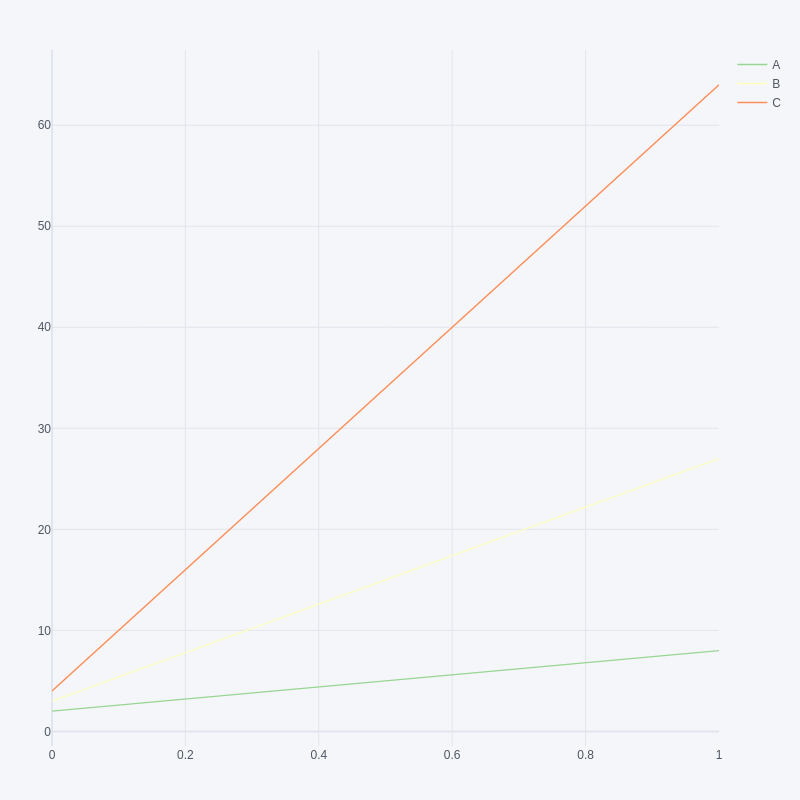
The Fig below shows the plot without hiding the legend entries:
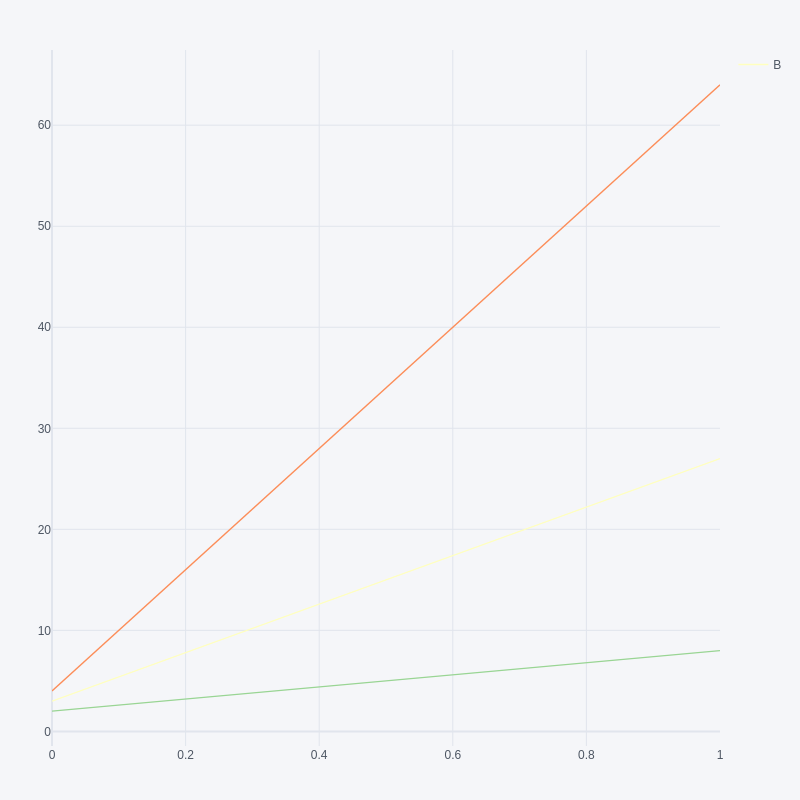
Method 1: Setting showlegend property by the name of the trace
Here we are going to set showlegend property to remove the legend entries in a plotly figure.
Python3
import pandas as pd
import plotly.offline as py
import plotly.graph_objs as go
import cufflinks as cf
cf.go_offline()
df = pd.DataFrame(data=[[2, 3, 4], [8, 27, 64]],
columns=['A', 'B', 'C'])
fig = df.iplot(kind='scatter', asFigure=True)
for trace in fig['data']:
if(trace['name'] != 'B'):
trace['showlegend'] = False
py.plot(fig)
|
Output:
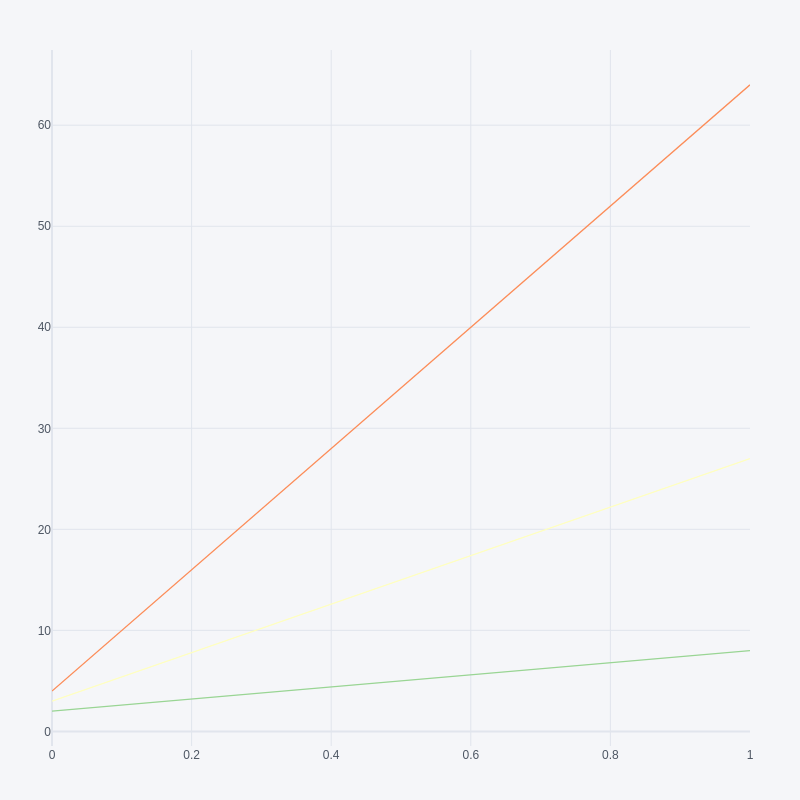
Method 2: Using the update function, remove all the entries
Here we are going to use the update function to remove all the entries
Python3
import pandas as pd
import plotly.offline as py
import plotly.graph_objs as go
import cufflinks as cf
cf.go_offline()
df = pd.DataFrame(data=[[2, 3, 4], [8, 27, 64]],
columns=['A', 'B', 'C'])
fig = df.iplot(kind='scatter', asFigure=True)
fig.update(layout_showlegend=False)
py.plot(fig)
|
Output:
Share your thoughts in the comments
Please Login to comment...