Top 10 ChatGPT Prompts to Boost Excel Productivity
Last Updated :
19 Feb, 2024
In the era of big data, Microsoft Excel continues to stand as a beacon for data analysis and organization. Its robust features and user-friendly interface make it an indispensable tool in today’s data-driven world. However, as the volume of data grows exponentially, so does the need for efficient ways to handle and interpret this data.
Enter ChatGPT, a state-of-the-art language model developed by OpenAI. By leveraging the capabilities of ChatGPT, you can significantly enhance your productivity in Excel. Whether it’s automating repetitive tasks, generating complex formulas, or interpreting large datasets, ChatGPT is equipped to streamline your Excel workflow.
In this article, we bring you 10 carefully curated ChatGPT prompts designed to optimize your Excel experience. These prompts will serve as your guide to unlocking the full potential of Excel, transforming it from a mere spreadsheet tool into a powerful ally in your data analysis journey. So, let’s dive in and explore these prompts that promise to take your Excel productivity to new heights.
Top 10 ChatGPT Prompts to Boost Excel Productivity
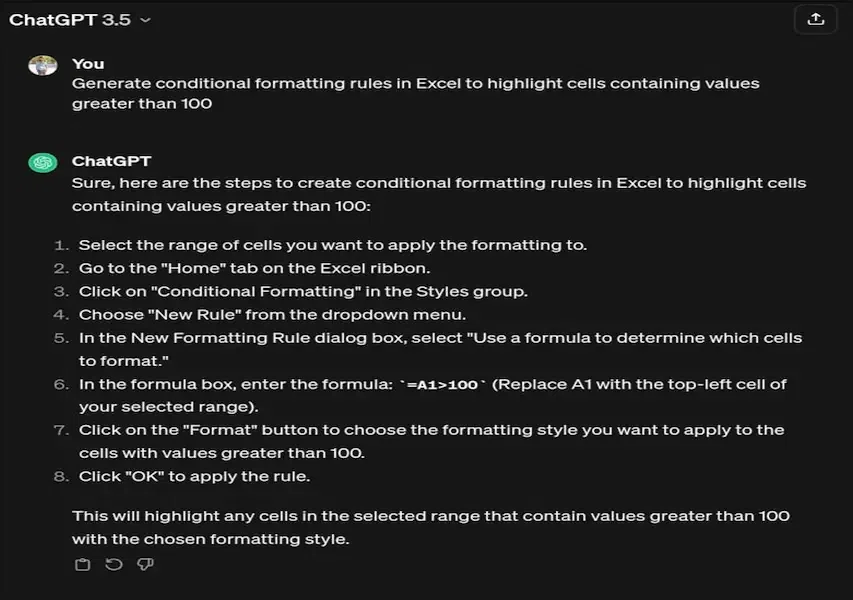
Generate conditional formatting rules in Excel to highlight cells containing values greater than 100:
Conditional formatting in Excel enables users to highlight data based on certain criteria, making insights more visible.
How it helps:
- By allowing users to generate conditional formatting rules in Excel to highlight cells containing values greater than 100, this feature significantly enhances data analysis and presentation.
- Conditional formatting serves as a powerful tool for visualising patterns and trends within large datasets, making it easier for users to identify and focus on specific information. In this particular scenario, the ability to automatically highlight cells with values exceeding 100 ensures that important data points stand out, facilitating quicker and more effective decision-making.
- This not only streamlines the process of identifying outliers or critical information but also enhances the overall clarity and interpretability of the data, ultimately contributing to more informed and efficient data-driven insights.
Prompt 2: Pivot Table in Excel
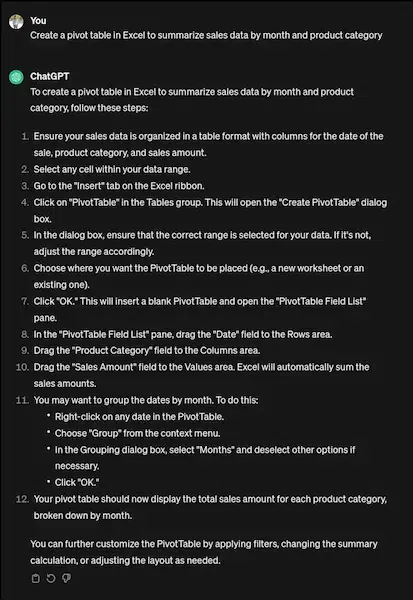
Create a pivot table in Excel to summarise sales data by month and product category.
Pivot tables empower users to easily summarise and analyse large datasets, swiftly extracting key insights.
How it helps:
- The creation of a pivot table in Excel to summarise sales data by month and product category offers a powerful tool for efficient data analysis. Pivot tables empower users by providing a user-friendly interface to organise and manipulate large datasets, enabling them to swiftly extract essential insights.
- By simply dragging and dropping fields, users can dynamically arrange and aggregate data, facilitating a clear representation of sales trends across different months and product categories.
- This not only streamlines the process of summarising information but also enhances decision-making by presenting a visually concise overview of the sales performance, aiding in identifying patterns, outliers, and strategic opportunities within the dataset.
- In essence, the pivot table function in Excel serves as an invaluable asset for users seeking to make informed decisions based on comprehensive and organised sales data analysis.
Prompt 3: Calculate the Average of Non-Contiguous cells
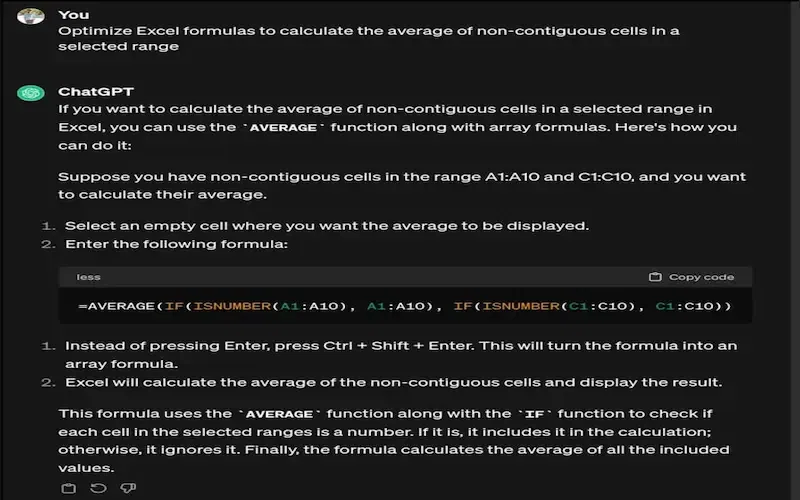
Optimise Excel formulas to calculate the average of non-contiguous cells in a selected range.
Excel formulas are the backbone of data manipulation and analysis, allowing for dynamic calculations and transformations.
How it helps:
- Optimising Excel formulas to calculate the average of non-contiguous cells in a selected range is instrumental in enhancing data manipulation and analysis efficiency. As the backbone of these processes, Excel formulas empower users to perform dynamic calculations and transformations.
- By fine-tuning formulas to handle non-contiguous cells, users can streamline the calculation of averages within specified ranges, improving overall spreadsheet functionality.
- This optimization not only saves time but also ensures accuracy in data analysis, making Excel an even more powerful tool for users engaged in diverse data-related tasks.
Prompt 4: Data Validation Rules in Excel
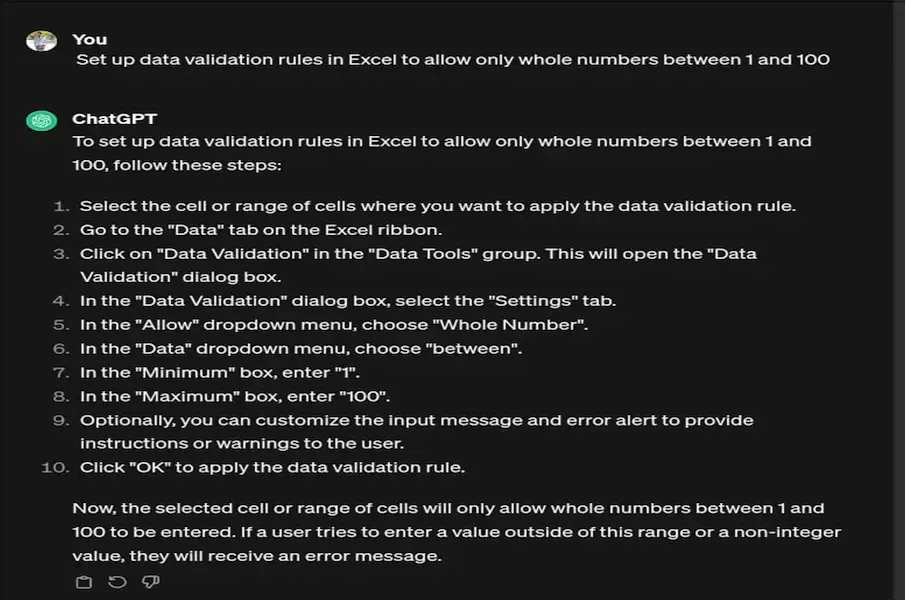
Set up data validation rules in Excel to allow only whole numbers between 1 and 100.
Data validation ensures data accuracy and consistency by restricting the type and format of user input in Excel cells.
How it helps:
- Setting up data validation rules in Excel to allow only whole numbers between 1 and 100 enhances data accuracy and consistency. By implementing these rules, users are guided to input only valid data, reducing the risk of errors and ensuring the integrity of the dataset.
- This not only streamlines data entry processes but also minimises the chances of miscalculations or inaccuracies that may arise from improper input.
- Furthermore, it provides a structured framework for users, promoting standardised and reliable data within the specified range.
- Overall, the implementation of data validation rules in Excel contributes significantly to maintaining data quality and facilitating more reliable analysis and decision-making processes.
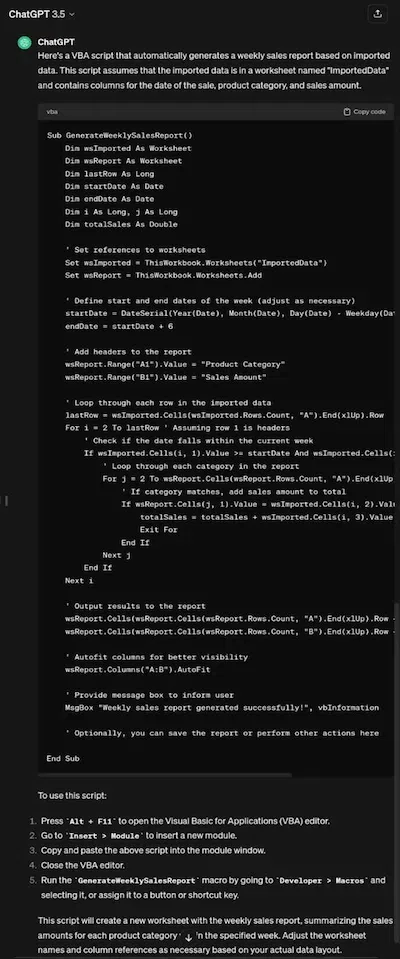
Prompt 5: VBA Script to Automatically Generate a Weekly Sales Report
Write a VBA script to automatically generate a weekly sales report based on imported data.
Visual Basic for Applications (VBA) in Excel enables users to automate repetitive tasks and extend Excel’s functionality.
How it helps:
- VBA, or Visual Basic for Applications, serves as a powerful tool within Excel, empowering users to automate monotonous tasks and enhance the program’s capabilities.
- In response to Prompt 5, creating a VBA script allows for the seamless generation of a weekly sales report by automating the process of importing data.This not only saves considerable time and effort but also minimises the risk of errors associated with manual data entry.
- Through VBA automation, users can ensure consistent and accurate weekly sales reports, promoting efficiency and reliability in business operations.
- The versatility of VBA in Excel makes it an indispensable resource for streamlining tasks and maximising productivity in data-driven workflows.
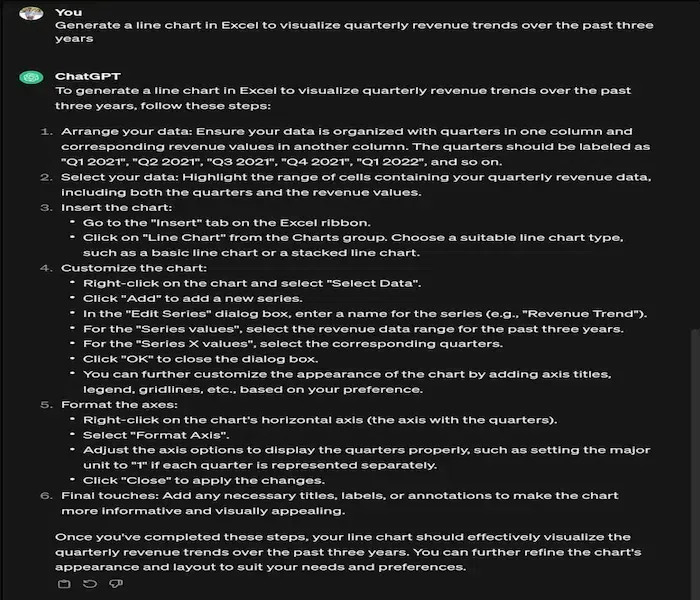
Prompt 6: Line Chart in Excel
Generate a line chart in Excel to visualise quarterly revenue trends over the past three years.
Charts in Excel facilitate data visualisation, making trends and patterns more understandable to users.
How it helps:
- The generation of a line chart in Excel to visualise quarterly revenue trends over the past three years significantly aids in enhancing data comprehension and decision-making.
- By leveraging the visual representation capabilities of charts in Excel, complex financial information is transformed into a clear and easily understandable format.
- The line chart effectively captures the quarterly revenue fluctuations, allowing users to discern patterns, identify trends, and make informed strategic decisions based on the visual insights provided.
- This visual representation not only streamlines the communication of financial data within an organisation but also empowers stakeholders to quickly grasp the revenue trajectory and respond proactively to market dynamics, ultimately fostering more informed and data-driven decision-making processes.
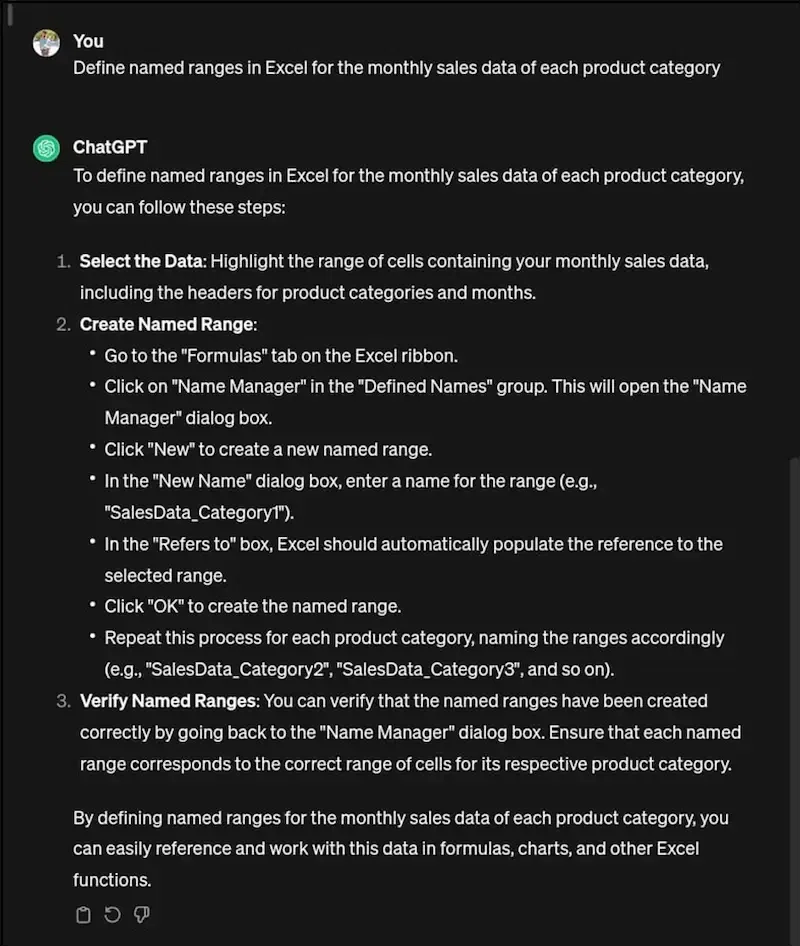
Prompt 7: Named Ranges in Excel for the Monthly Sales Data
Define named ranges in Excel for the monthly sales data of each product category.
Named ranges in Excel allow users to assign descriptive names to specific cell ranges, enhancing readability and usability.
How it helps:
- Defining named ranges in Excel for the monthly sales data of each product category provides significant advantages in terms of data organisation and analysis. By assigning descriptive names to specific cell ranges, users can streamline spreadsheet navigation and make the monthly sales data more accessible.
- This not only enhances the overall readability of the Excel document but also improves usability, making it easier to refer to and manipulate data related to different product categories.
- Named ranges facilitate efficient formula creation, data validation, and chart generation, enabling users to seamlessly analyse trends and make informed business decisions based on the organised and easily identifiable monthly sales data for each product category.
Prompt 8: Dropdown List in Excel
Create a dynamic dropdown list in Excel to select products based on their corresponding category.
Dynamic data validation lists in Excel enable users to create dropdown menus that update automatically based on changing criteria.

How it helps:
- Dynamic dropdown lists in Excel significantly enhance data management and streamline decision-making processes. When it comes to selecting products based on their corresponding category, this feature offers several advantages.
- Firstly, it improves efficiency by simplifying the user experience. With a dynamic dropdown list, users can easily navigate through product categories without manually updating the list. This eliminates the need for constant manual adjustments, saving time and reducing the likelihood of errors.
- Secondly, it promotes accuracy and consistency in data entry. By restricting selections to predefined categories, the dynamic dropdown list ensures that users choose from valid and updated options. This helps maintain data integrity and minimises the risk of entering incorrect information.
- Additionally, dynamic dropdown lists enhance data organisation. Users can quickly filter and analyse information based on specific product categories, facilitating better data management and decision-making. This functionality is particularly valuable in scenarios where large datasets need to be sorted and analysed efficiently.
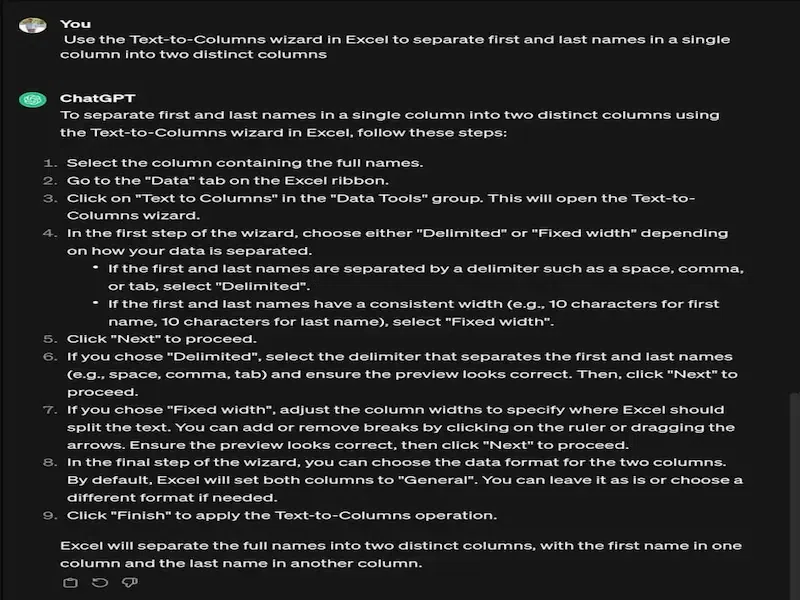
Prompt 9: Text-to-Columns in Excel to Separate First and Last Names
Use the Text-to-Columns wizard in Excel to separate first and last names in a single column into two distinct columns.
The Text-to-Columns feature in Excel allows users to split text strings into separate columns based on specified delimiters.
How it helps:
- The Text-to-Columns wizard in Excel proves invaluable for efficiently managing data by facilitating the separation of first and last names in a single column into distinct columns. This feature aids in enhancing data organisation, analysis, and presentation.
- Firstly, the Text-to-Columns wizard is user-friendly, providing a step-by-step approach to splitting text. It eliminates the manual effort required to separate first and last names, saving time and minimising errors.
- By allowing users to specify delimiters such as spaces or commas, the wizard accommodates varying data formats, ensuring flexibility in handling diverse datasets.
- Furthermore, this feature enhances data clarity. Separating names into distinct columns promotes readability and simplifies sorting and filtering tasks. Users can easily perform alphabetical sorts based on last names or conduct analyses specific to first names, streamlining data manipulation processes.
Prompt 10: Goal Seek in Excel
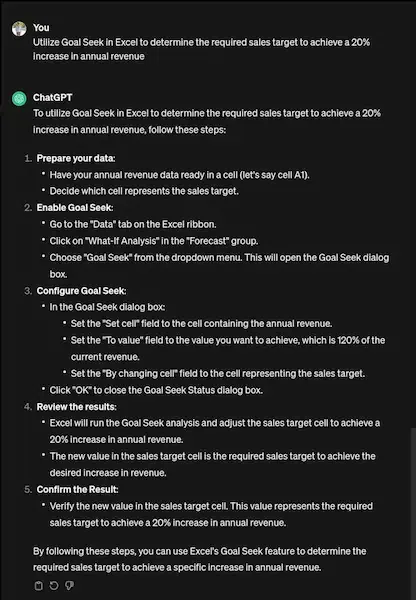
Utilise Goal Seek in Excel to determine the required sales target to achieve a 20% increase in annual revenue.
Goal Seek in Excel enables users to find the input value necessary to achieve a desired output, helping solve what-if scenarios.
How it helps:
- Goal Seek in Excel proves invaluable when determining the required sales target to achieve a 20% increase in annual revenue. This feature facilitates efficient financial planning and strategy development by allowing users to identify the necessary input values to meet specific goals.
- By utilising Goal Seek, businesses can streamline their decision-making processes. Instead of manually adjusting various parameters to observe their impact on revenue, users can set a target increase of 20% and let Goal Seek automatically calculate the corresponding sales target. This not only saves time but also enhances accuracy, as the tool considers complex interdependencies within the spreadsheet.
- Moreover, Goal Seek aids in scenario analysis, enabling organisations to assess different sales target scenarios and their implications on overall revenue.
- This proactive approach empowers businesses to make informed decisions, optimise resource allocation, and align their efforts towards achievable financial objectives.
Conclusion
The integration of ChatGPT prompts into your Excel workflow can indeed revolutionize your data analysis and manipulation processes. By significantly enhancing your productivity and efficiency, these prompts allow you to harness the full power of Excel in a more user-friendly and effective manner. Whether you’re performing simple tasks or complex data operations, these prompts are designed to enrich your experience with the Excel application.
In conclusion, the fusion of ChatGPT’s AI capabilities with Excel’s robust features opens up a world of possibilities for data handling and interpretation. It’s not just about working harder, but smarter. So, embrace these prompts and let them guide you on your journey to becoming a more proficient and efficient Excel user. Happy data crunching!
Related Articles:
FAQs – ChatGPT Prompts to Boost Excel Productivity
What are ChatGPT prompts for Excel productivity?
ChatGPT prompts are predefined commands you can input into ChatGPT to automate various tasks in Excel, such as data analysis, formatting, and automation.
How do ChatGPT prompts enhance Excel productivity?
ChatGPT prompts streamline Excel workflows by automating repetitive tasks, simplifying complex operations, and providing quick solutions to common challenges.
Can ChatGPT prompts be customized for specific Excel tasks?
Yes, ChatGPT prompts can be customized to address specific Excel tasks, such as generating pivot tables, creating charts, or automating data validation processes.
Are ChatGPT prompts suitable for Excel beginners?
While some ChatGPT prompts may require intermediate to advanced Excel skills, there are also prompts designed to assist beginners in learning and mastering essential Excel functions.
5. Where can I find more ChatGPT prompts for Excel productivity?
You can explore online resources, forums, and communities dedicated to Excel and ChatGPT to discover new prompts, share experiences, and learn from others’ insights.
Share your thoughts in the comments
Please Login to comment...