Hanning in Numpy | Python
Last Updated :
22 Jul, 2021
The Hanning window is a taper formed by using a weighted cosine.
Syntax:  numpy.hamming(M)

Parameters:
M :  Number of points in the output window.

Returns:  AN array
The window, with the maximum value normalized to one (the value one appears only if M is odd).
Code #1:
import numpy as np
print(np.hanning(12))
|
Output:
[ 0.          0.07937323  0.29229249  0.57115742  0.82743037  0.97974649
  0.97974649  0.82743037  0.57115742  0.29229249  0.07937323  0.        ]
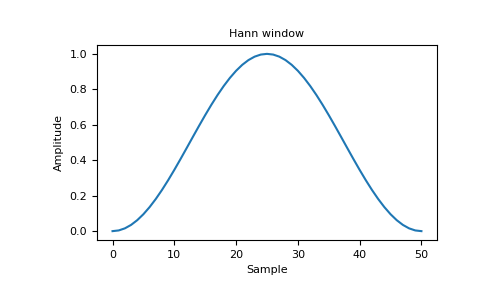
Code #2: Plotting the window and its frequency response (requires SciPy and matplotlib).
import numpy as np
import matplotlib.pyplot as plt
from numpy.fft import fft, fftshift
window = np.hanning(51)
plt.plot(window)
plt.title("Hann window")
plt.ylabel("Amplitude"")
plt.xlabel("Sample")
plt.show()
|
Output:
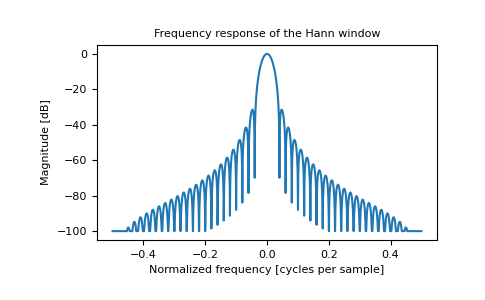
For frequency:
import numpy as np
import matplotlib.pyplot as plt
from numpy.fft import fft, fftshift
window = np.hanning(51)
plt.figure()
A = fft(window, 2048) / 25.5
mag = np.abs(fftshift(A))
freq = np.linspace(-0.5, 0.5, len(A))
response = 20 * np.log10(mag)
response = np.clip(response, -100, 100)
plt.plot(freq, response)
plt.title("Frequency response of Hanning window")
plt.ylabel("Magnitude [dB]")
plt.xlabel("Normalized frequency [cycles per sample]")
plt.axis("tight")
plt.show()
|
Output:
Share your thoughts in the comments
Please Login to comment...