SQL Server is a Relational Database Management System that is used to create and manipulate the database. It provides advanced security measures like encryption, access control, and auditing to protect sensitive data from unauthorized access.
It Supports a wide range of data types, including structured, semi-structured, and unstructured data, for effective data storage and management. It also Supports various programming languages and offers tools like SQL Server Management Studio for simplified database administration and development.
In this article, we are going to learn about the GROUPING_ID() Function in SQL Server. We will learn how we can implement the use of this function through various practical examples. We will learn how this function can be used with single as well as multiple columns in the SQL server.
GROUPING_ID Function in SQL Server
The GROUPING_ID() function in SQL Server is a great tool that helps to determine the grouping levels in the grouped queries performed by the user. GROUPING_ID function is only applicable in a SELECT statement that contains a GROUP BY extension, such as ROLLUP or GROUPING function.
In complex queries where many GROUPING functions are involved calculations of the Group level of a particular row become complex. GROUPING_ID is very useful in these cases, it takes the results of multiple GROUPING functions and concatenates them into a bit vector.
By using the GROUPING_ID function we can avoid the need for multiple GROUPING functions and make row filtering conditions easier to express. Row filtering becomes easy with GROUPING_ID because the desired rows can be identified with a single condition of GROUPING_ID = n.
Syntax:
GROUPING_ID ( column1,column2,column3,.... columnN )
Explanation: The syntax of the GROUPING_ID function is quite simple. It just accepts the names of the columns as arguments on which the grouping is applied and returns an integer value that denotes the grouping level in the database.
Application of GROUPING_ID Function
- Hierarchical Reporting: GROUPING_ID() function can be used with GROUP BY and ROLLUP clauses easily to create hierarchical reports. It helps to distinguish between different grouping levels making it easy for the user to analyze the report.
- Conditional Aggregation: GROUPING_ID() function can be used along with the WHERE clause IN SQL Server to selectively aggregate data based on the grouping levels, allowing more flexible and customized analysis for the data.
- Trouble-Free Row Filtering: The desired rows from the result can be filtered easily with the help of GROUPING_ID() function. Just by using the GROUPING_ID()= n condition where n denotes the row number the rows can be easily filtered.
- Integration with Aggregate Functions: The GROUPING_ID() function can be easily combined with aggregate functions like SUM(), COUNT(), and AVG() to perform more filtered analysis on the data and fetch the desired results.
Examples of GROUPING_ID Function
To understand the GROUPING ID function, We need a Table on which we will perform various operations and queries. So here we have
IndianEmployees Table which consist of EmployeeID, FirstName, LastName, Department, City and Salary as Columns. After Inserting some data into the table, The table looks:
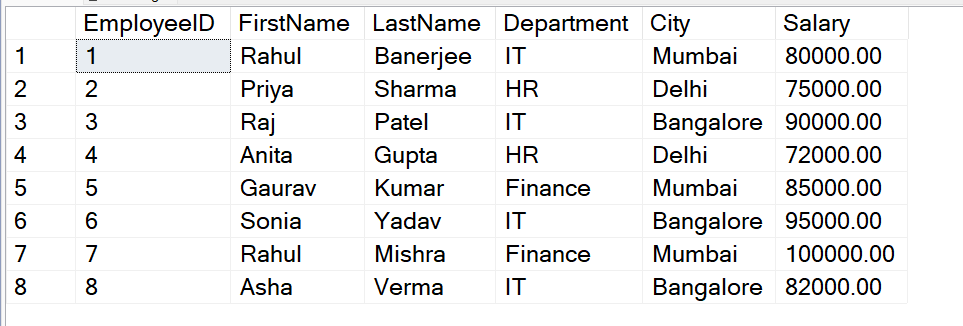
Table-IndianEmployees
Example 1: Simple Use of GROUPING_ID Function
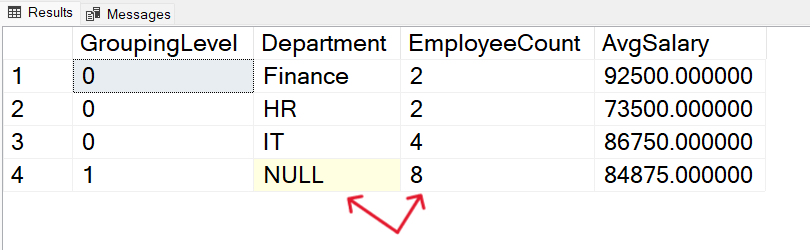
Let’s Determine the number of employees and average salary within each department, as well as the overall company-wide totals, to gain insights into employee distribution and compensation across different departments.
Query:
SELECT
    GROUPING_ID(Department) AS GroupingLevel,Department,
    COUNT(*) AS EmployeeCount,
    AVG(Salary) AS AvgSalary
FROM IndianEmployees
GROUP BY
    GROUPING SETS ((Department), ());
Output:
Output
Explanation: In the following example, We have shown the basic use of GROUPING_ID function to identify the grouping levels in a table. We have grouped the data by the column department and calculated the average salary of each department using the aggregate function AVG(). The Grouping level of the last record is 1 as compared to other records because it denotes the total sum of all the departments in the table which is at a higher hierarchy as compared to others.
Example 2: GROUPING_ID Function with Multiple Columns
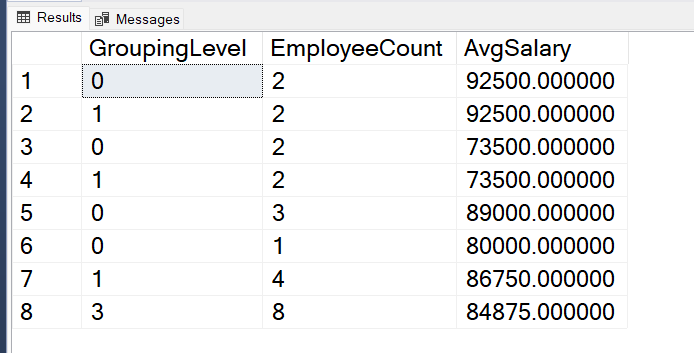
Let’s Count employees and see their average salary in both departments and cities. Also, check the same for only departments and ignoring cities. Then, find out total employees and their average salary across the whole company.
Query:
SELECT
    GROUPING_ID(Department, City) AS GroupingLevel,
    COUNT(*) AS EmployeeCount,
    AVG(Salary) AS AvgSalary
FROM IndianEmployees
GROUP BY
    GROUPING SETS ((Department, City), (Department), ());
Output:
Output
Explanation: In the following example, We have learnt the use of GROUPING_ID function along with multiple columns in the SQL server. The query groups the result set based on two columns Department and City and displays how GROUPING_ID function handles grouping of multiple levels. The last records has the highest grouping level because it groups the whole data and give the average salary of the total employees present in the table.
Example 3: GROUPING_ID Function with WHERE Clause
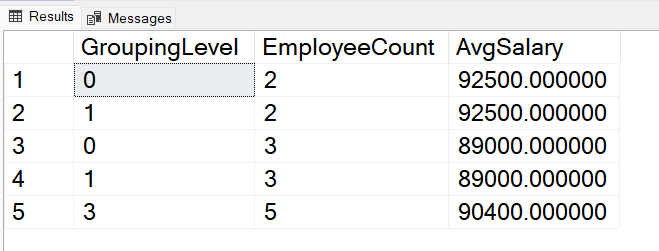
Suppose We want to find out those employees who are making over 80,000 rupee, and how much they earn on average in different departments and cities, and the overall distribution of high salaries across the company.
Query:
SELECT
    GROUPING_ID(Department, City) AS GroupingLevel,
    COUNT(*) AS EmployeeCount,
    AVG(Salary) AS AvgSalary
FROM IndianEmployees
WHERE Salary > 80000
GROUP BY
    GROUPING SETS ((Department, City), (Department), ());
Output:
Output
Explanation: In this example the GROUPING_ID function is used to calculate the grouping levels of data that is grouped using multiple columns and WHERE clause is used to filters the result set. All the records having the salary field greater than 80000 are only considered in the final result set. All the other records are filtered out from the result set using the WHERE clause.
Example 4: GROUPING_ID Function with SUM Function
Let us consider the following dummy table Sales on which we will perform our next query.

Table-Sales
Query:
Let’s Analyze sales performance by product, region, and overall to understand sales distribution, regional variations, and product-specific contributions to revenue.
SELECT
    GROUPING_ID(Product, Region) AS GroupingLevel,Product,Region,
    COUNT(*) AS SalesCount,
    SUM(SalesAmount) AS TotalSales
FROM
    Sales1
GROUP BY
    GROUPING SETS ((Product, Region), (Product), ());
Output:

Output
Explanation: In this example, We have used the GROUPING function to generate subtotals and totals for both the Product and Regions field. The aggregate function SUM() is used to calculate the total sales amount. The records with NULL values denotes the grouped result of a region or multiple regions. The last records has the highest grouping level 3 because it denotes the total sales amount of both the products in the table. The fields with grouping level 1 denotes the total sales amount of each product in all the regions combined. The fields with grouping level 0 is at the lowest level which denotes the total sales amount of each product in each separate region.
Conclusion
In the following article, We have learned the use of GROUPING_ID function in SQL server. We have learned various applications of GROUPING_ID function through various examples. We saw that how GROUPING_ID functions makes it easy to calculate the grouping levels where multiple GROUPING of rows is involved.
Share your thoughts in the comments
Please Login to comment...