Decoding information from the strace output
Last Updated :
20 Oct, 2020
When a program is executed, it toggles multiple times into user mode and kernel mode. In user mode, a process has limited access to resources, while in kernel mode it has access to privileged hardware resources and its data. A process toggles from user mode to kernel mode using System Calls.
Strace is a tool to analyze system call activities of a process. It gives us information about:
- Files accessed.
- Used system calls during the execution
- Time taken by each system call for a process etc.
Analyzing system calls helps a lot when you do not have access to source code and debugging is done using executable binary only. This article is not about How To use Strace tool, its more about analyzing the output of Strace tool because while executing Strace on a process, it dumps a lot of information related to system calls. At first instance, it looks very scary and analyzing each system call would be a very time-consuming task. Moreover, it may not be required because most of the starting system calls are for the housekeeping purpose and do not add much value to debugging. Once system call flow is understood for one process, then it can be easily identified and remove housekeeping system calls and concentrate on important one for debugging our actual problem.
Program:
C
#include <stdio.h>
int main(int argc, char* argv[])
{
printf(" geeksforgeeks: hello world !! \n");
return 0;
}
|
Output:
geeksforgeeks: hello world !!
Compile the above program using the below command:
$ gcc hello.c
Find the Strace out of the above-compiled program using the below command:
$ strace ./a.out
Now, the Strace output for the above program is:
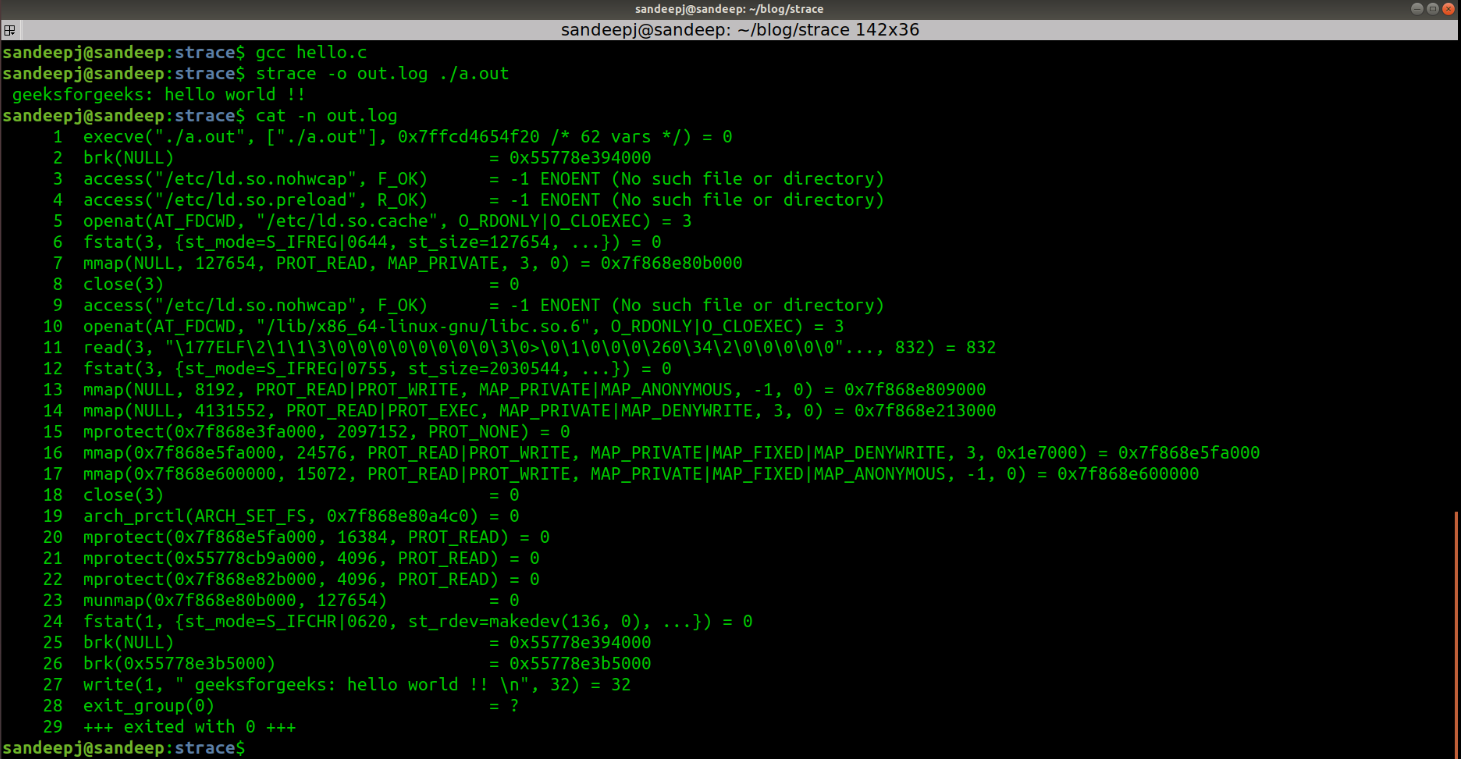
Before starting analyzing system calls, let’s briefly talk about program execution w.r.t. system calls:
- The “Hello World” program will open and memory maps to all the shared libraries into virtual memory of the process. Most of the system calls are related to this activity.
- Sets correct access for the memory sections.
- And finally executes the program, which will write message “geeksforgeeks: hello world !!” into stdout of the process.
Decoding Strace Output:
Now break the Strace output into meaningful chunks for better understanding:
- execve():
When we run ./a.out executable in bash console, a new child process is forked and execve() is run to load new program “a.out”.

It has 3 parameters:
- The first parameter is the executable name
- The second parameter is an array of arguments of executable, of which the first argument is the executable name itself. Since no argument is given to executable, we see only ./a.out into the argument list.
- The third parameter is a string of environment variables.
Here return value is 0, which means success. More details about execve() system call can be found on the man page of execve using “man 2 execve”.
- brk(): This system call sets data segment size to the specified address. Here brk(NULL) is used to get the top of the data segment address, which is the heap start address. Hence, calling brk() with NULL returns, heap start address which is later used to allocate heap memory.

- access(): This system call checks about file permissions. It has 2 parameters:
- The first parameter is a filename for which permission has to be checked.
- The second parameter is a mode, which specifies the accessibility check. Read, Write, and Executable accessibility are checked for a file. Here F_OK is for existence check and R_OK is for reading check.
- If the return value is -1, which means checked file is not present.

- ld.so.nohwcap: The presence of this file disables the loading of optimized libraries. In the latest distributions, this file is not present. ld.so.preload file containing a list of shared object files to be loaded before the program.

- openat() opens a file /etc/ld.so.cache and returns files descriptor 3. /etc/ld.so.cache, contains the list of directories in which shared libraries shall be searched on.
- fstat() gets the file attributes like modes, size, creation/modification timestamps, etc for the same file descriptor. The second parameter is the details of the attributes read.
- mmap() uses file size 127481, read by fstat() and maps entire file into virtual memory of process and returns mapped virtual memory address 0x7ff58cf81000.
- After successful mapping, the file is closed using close() system call.
- /etc/ld.so.cache: This contains the list of directories in which shared libraries shall be searched on.

This is the same as line 3.
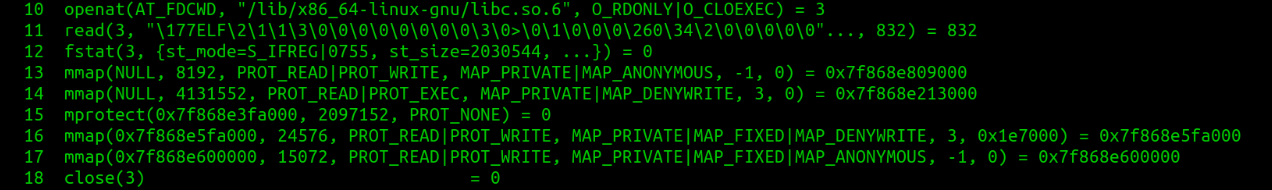
The above chunk of system calls are about opening libc library and mapping it into virtual memory of the process.
- openat() opens /lib/x86_64-linux-gnu/libc.so.6 and returns files descriptor 3. File descriptor 3 is used further to work on libc file.
- read() reads 832 bytes of libc.so file. The second parameter is read 832 bytes of data, which is header information of ELF file and probably used for verification of ELF file.
- fstat() gets the libc file attributes.
- mmap() maps the file into virtual memory.
- mprotect() updates the protection of the memory region.
- close() free the file descriptor, as the file is mapped successfully into process virtual memory and no more accessing through a file descriptor is required.
- arch_prctl(): It sets architecture-specific thread state. Here it is setting 64-bit base for FS register to address 0x7ff58cf804c0.

- mprotect(): This calls to set protection for different memory regions. PROT_READ is used to make memory regions readable.

- munmap(): This call to unmap file /etc/ld.so.cache. Address 0x7ff58cf81000 was mapped to ld.so.cache in line 7.

- fstat(): This is done on file descriptor 1, to get it’s attributes, as printf() will write data using stdout descriptor.

When a process starts, it open 3 default files:
- File descriptor 0 for stdin.
- File descriptor 1 for stdout.
- File descriptor 2 for stderr.
- brk(): This calls to get and set data section boundary.

- This is corresponding to printf() statement, which puts data on stdout of process using write() system call.

- Program exits with 0(SUCCESS).

Now it has seen that most of the system calls were to prepare process to execute. Mostly shared library mapping was causing most of the system calls. It can cross-check this by running Strace on statically built executable binary.
Below is the Strace output for the “Hello World” program built using “-static” option:
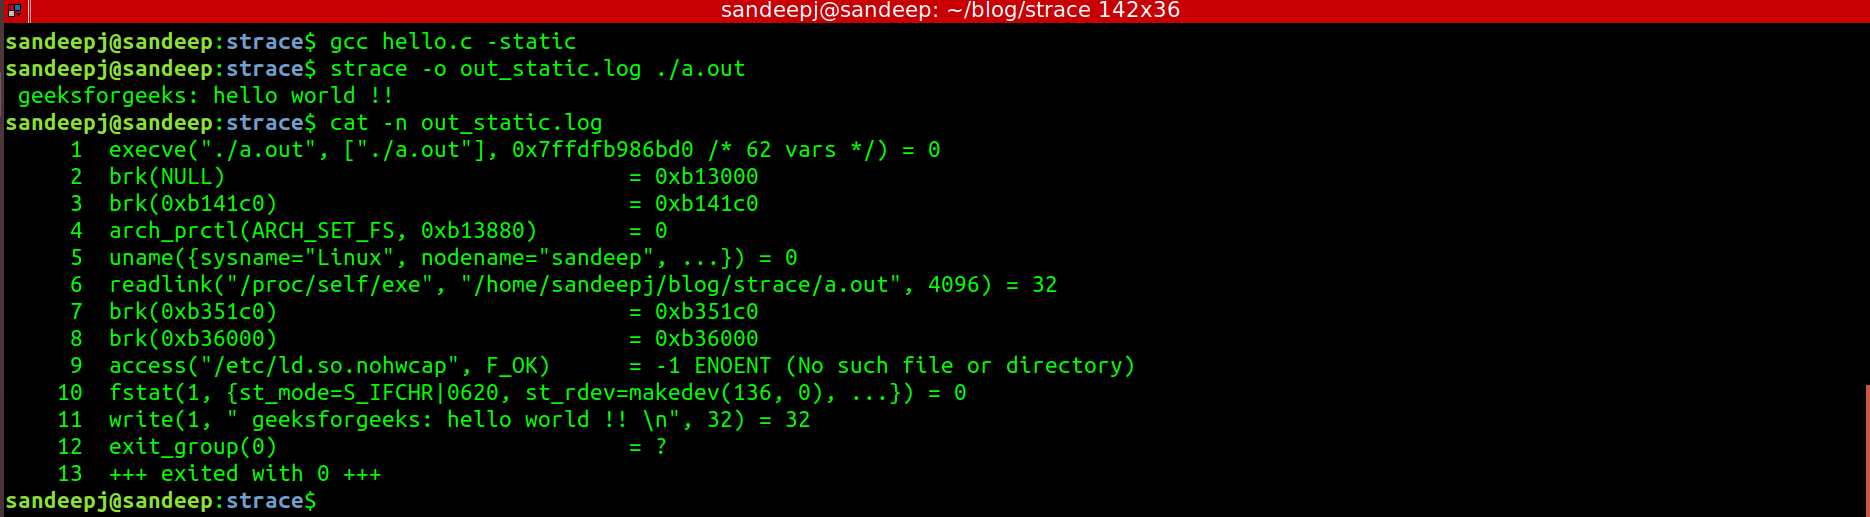
It can see that statically built executable does not call open(), mmap(), close() etc, which was done to map shared libraries. Now we have enough understanding about system calls to analyze Strace tool output and to filter out interested system calls for debugging. For any system call detail, best place would be its man page. Which can be accessed using below command.
$ man 2 <System Call>
Share your thoughts in the comments
Please Login to comment...