Compute the histogram of nums against the bins using NumPy
Last Updated :
17 Dec, 2021
In this article, we are going to discuss how to compute the nums against the bins using the NumPy module. A histogram is the best way to visualize the frequency distribution of a dataset by splitting it into small equal-sized intervals called bins. The Numpy histogram function is similar to the hist() function of matplotlib library, the only difference is that the NumPy histogram gives the numerical representation of the dataset while the hist() gives a graphical representation of the dataset.
While creating a histogram, it is better not to think in the terms of the bins rather than to find how many times each value appears i.e. a frequency table. For this purpose a python dictionary is well-suited. Below is the simple implementation of the histogram in pure python:
Python3
a = (1, 3, 7, 7, 2, 3, 4, 7, 6, 6, 3, 5, 2)
hist = {}
for i in a:
hist[i] = hist.get(i, 0) + 1
print(hist)
|
Output:
{1: 1, 3: 3, 7: 3, 2: 2, 4: 1, 6: 2, 5: 1}
Numpy has a built-in numpy.histogram() function which represents the frequency of data distribution in the graphical form. The rectangles having equal horizontal size corresponds to class interval called bin and variable height corresponding to the frequency.
Syntax: numpy.histogram(data, bins=10, range=None, normed=None, weights=None, density=None)
Parameters:
- data: array or sequence of array to be plotted.
- bins: int or sequence of str defines number of equal width bins in a range, default is 10.
- range: optional parameter sets lower and upper range of bins.
- normed: optional parameter same as density attribute, gives incorrect result for unequal bin width.
- weights: optional parameter defines array of weights having same dimensions as data.
- density: optional parameter if False result contain number of sample in each bin, if True result contain probability density function at bin.
Implementation:
Python3
import numpy as np
a = np.random.randint(100, size =(50))
np.histogram(a, bins = [0, 10, 20, 30, 40,
50, 60, 70, 80, 90,
100])
hist, bins = np.histogram(a, bins = [0, 10,
20, 30,
40, 50,
60, 70,
80, 90,
100])
print (hist)
print (bins)
|
Output:
[5 7 4 7 4 5 1 6 4 7]
[  0  10  20  30  40  50  60  70  80  90 100]
Here, The np.histogram() function has two return values hist which gives the array of values of the histogram, and edge_bin which is an array of float datatypes containing the bin edges having length one more than the hist.
The above numeric representation of the histogram can be converted into a graphical form. The plt() function present in pyplot submodule of Matplotlib takes the array of dataset and array of bin as parameter and creates a histogram of the corresponding data values. Below are some examples to compute the histogram of nums against the bins:
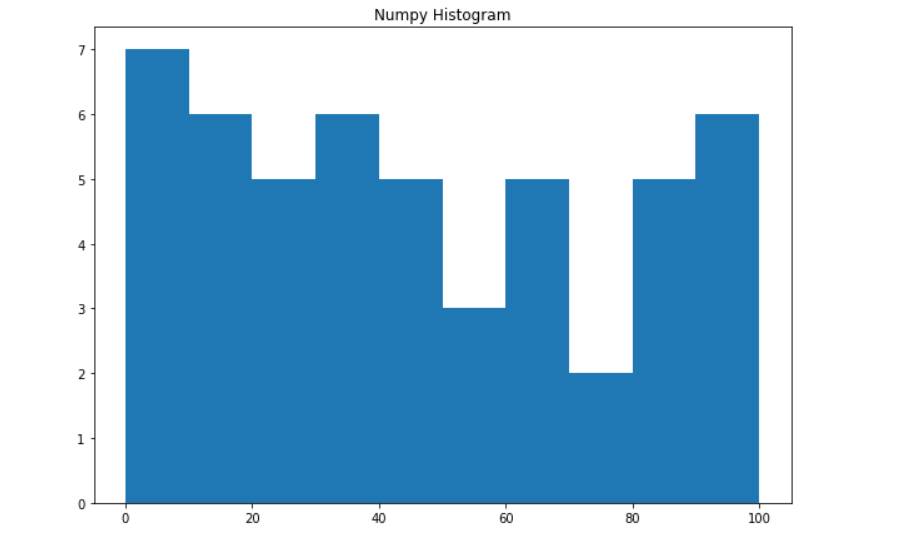
Example 1:
Python3
from matplotlib import pyplot as plt
import numpy as np
a = np.random.randint(100, size=(50))
fig = plt.figure(figsize=(10, 7))
plt.hist(a, bins=[0, 10, 20, 30,
40, 50, 60, 70,
80, 90, 100])
plt.title("Numpy Histogram")
plt.show()
|
Output:
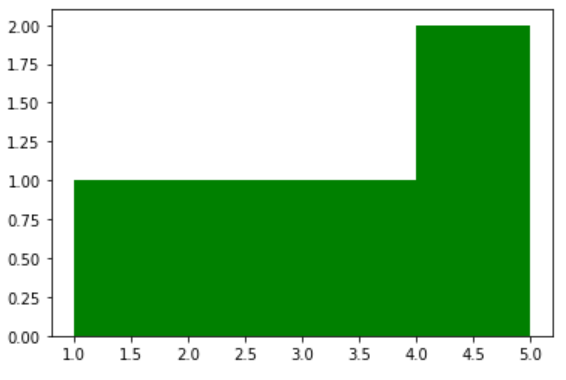
Example 2:
Python3
from matplotlib import pyplot as plt
import numpy as np
l = [i for i in range(50)]
plt.hist(l, bins=[1, 2, 3, 4, 5],
color='green')
plt.show()
|
Output:
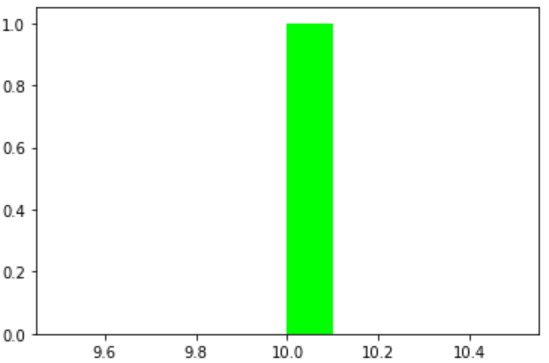
Example 3:
Python3
from matplotlib import pyplot as plt
import numpy as np
l = np.random.randint(150)
plt.hist(l, bins=l,
color='lime')
plt.show()
|
Output:
Share your thoughts in the comments
Please Login to comment...