By Using Gantt chart, Plan the Project work streams
Last Updated :
02 Apr, 2024
Workstreams are the small parts of a big project in project management. In each work stream specific tasks related to the project are completed and in the end, by this work stream our project gets completed. They help to break down big projects into smaller and more manageable tasks. To make a project successful it is equally important to manage these work streams so that everyone knows about their responsibility in the project. So in this article, we are going to learn about Gantt charts which help in managing work streams, making it easier to keep track of the project’s progress at each stage.
Introduction to Gannt charts in Project Management
Gantt chart shows all the tasks in a project and the time when they need to be completed. It consists of horizontal bars, each representing a task and the length of the bar shows the time required to complete the task. It helps in organizing the tasks and makes it easy to spot potential problems, like overlapping tasks or one task taking too long time than required. So now we will see how these Gantt charts are used to plan the project work streams.
Steps to build a Gantt chart in Project Management
Here are the steps below to build a Gantt chart:
- In a project initially understand the essential tasks and make a list of what tasks need to be completed and the time you want to spend for the completion of each task.
- Now knowing the relationship between tasks, means finding which tasks are dependent on another task. For example, you can’t test the website until it is built.
- Draw a horizontal timeline representing the duration of the project. For this, you can use the spreadsheet. project management software or any other Gantt chart tools.
- Now add the tasks on this timeline one by one according to their sequence of completion from start to end. Initially add the first task you want to complete and in the end, add the task that completes your project and all the other tasks add in between these.
- Now you can add dates, resources progress(for the tasks that are completed) and any other information you want to add.
- Once the chart is created remember to update it as your project continues and review this chart daily to know about progress and other changes to your project.
Example of Gantt chart in Project Management
Now we will see one example of a Gantt chart for better understanding,
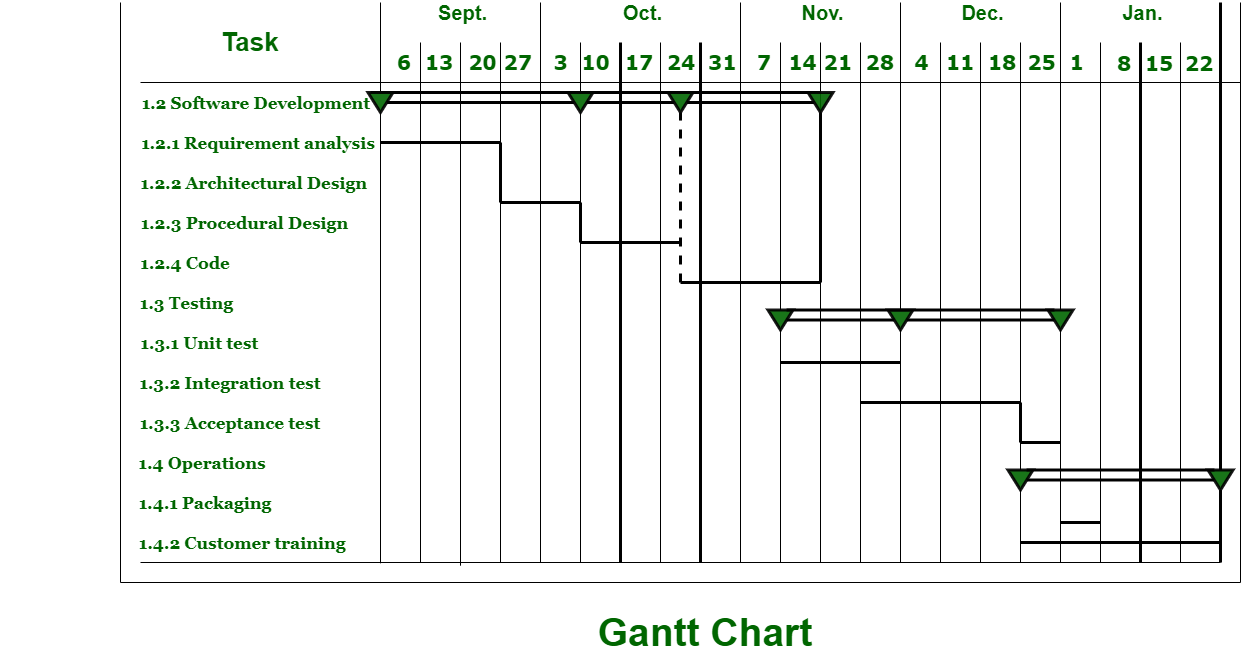
Gantt Chart Examples
In above gantt chart we are planning to make a website . So first of all we will research and plan on the topic we need and it is the first task to do. Then we will perform frontend development , backend developement , testing and deploying in a sequence shown. So this is gantt chart , it helps to visualize the project and makes it easy to proceed.
Example of workstream in Project Management
As shown in above example , this is basically one example of workstreams where big project is divided into smaller workstreams. there are five work streams as follows in above example
- Researching and planning
- Frontend developement
- Backend developement
- Testing
- Deployment
Workstream best practices for project managers
Project managers can optimize their workstreams by implementing the following best practices:
- Clear Goal Setting: Define clear and achievable project goals at the outset to provide direction and focus for the team.
- Detailed Planning: Break down the project into smaller tasks and create a detailed project plan outlining timelines, dependencies, and resources required.
- Effective Communication: Maintain open and transparent communication channels with team members, stakeholders, and clients to ensure everyone is aligned and informed about project progress and changes.
- Agile Methodology: Embrace agile project management principles such as iterative development, regular feedback loops, and adaptability to changes, enabling faster delivery and flexibility.
- Prioritize Tasks: Use prioritization techniques like the Eisenhower Matrix or MoSCoW method to identify and focus on high-priority tasks, ensuring resources are allocated effectively.
- Resource Allocation: Allocate resources efficiently based on skill sets, availability, and task requirements to optimize productivity and minimize bottlenecks.
By incorporating these best practices into their workstreams, project managers can enhance efficiency, collaboration, and ultimately, project success.
Benefits of using gantt chart
The benefits of using gantt chart are following:
- Gantt chart provides a visual representation of all the tasks in a project which makes it easy to understand the sequence and progress in project.
- It helps project managers to track project timelines and it makes it easy to schedule tasks effectively.
- It helps in understanding the dependencies in tasks so that the project follows correct path and no problem arises in between.
- Gantt chart helps in allocating resources effectively as per the need , it prevents overallocation or underutillization of resources.
- Gantt chart provide valuable insights that help in decision making throughout the project lifecycle.
Gantt chart offers number of benefits that contribute to improved project planning, management and execution which leads to more successful project completion.
Conclusion: Gantt chart
In summary, effective project management hinges on adept workstream management, essential for breaking down complex projects into manageable tasks. Workstreams, aided by tools like Gantt charts, facilitate clear task delineation, timeline tracking, and resource allocation. Implementing best practices such as goal setting, detailed planning, communication, and agile methodologies optimizes workstream efficiency. Gantt charts offer visual task representation, aiding decision-making and project planning. By adhering to these practices and leveraging tools effectively, project managers can enhance efficiency, collaboration, and ultimately, project success.
FAQs: Gantt chart
Q. What is gantt chart ?
A gantt chart is a visual tool used in project management to display the timeline of tasks and their relationships.
Q. How to create a gantt chart ?
To create gantt chart, you can use specialized project management softwares like microsoft project, excel or online tools . Just list the tasks and assign duration , establish their relationships and plot them on a timeline to visualize the project schedule.
Q. What is work stream in project ?
Work stream is a small part of big projects , it divides the project into small tasks and in the end by completion of these work streams the project gets completed.
Share your thoughts in the comments
Please Login to comment...