Angular PrimeNG BarChart Vertical
Last Updated :
07 Nov, 2022
Angular PrimeNG is an open-source framework with a rich set of native Angular UI components that are used for great styling and this framework is used to make responsive websites with very much ease. In this article, we will see the Bar Chart Vertical in Angular PrimeNG.
A Bar Chart or bar graph is a chart that presents Grouped data with rectangular bars with lengths proportional to the values that they represent. In Bar chart vertical, datasets are represented in a vertical orientation.
Angular PrimeNG BarChart Vertical Attributes:
- data: It represents the data that is to be to displayed.
- options: It represents the options to be customized in the chart.
Syntax:
<p-chart type="bar"
         [data]="Data"
         [options]="basicOptions">
</p-chart>
Creating Angular application & Module Installation:
Step 1: Create an Angular application using the following command.
ng new appname
Step 2: After creating your project folder i.e. appname, move to it using the following command.
cd appname
Step 3: Install PrimeNG in your given directory.
npm install primeng --save
npm install chart.js --save
npm install primeicons --save
Project Structure: It will look like the following:
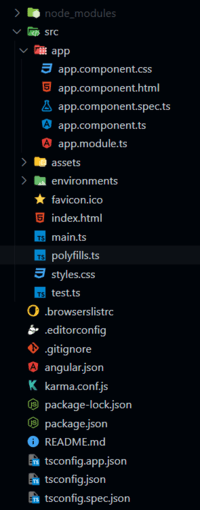
Project Structure
Example 1: This example describes the basic usage of the BarChart Vertical in Angular PrimeNG. Here, we will create a vertical bar chart using single dataset
HTML
<div id="GFG">
<h1 style="color:green">GeeksforGeeks</h1>
<h2>Angular PrimeNG Bar Chart Vertical</h2>
<div style="width:70%;">
<p-chart type="bar"
[data]="basicData"
[options]="basicOptions">
</p-chart>
</div>
</div>
|
Javascript
import { Component } from '@angular/core';
@Component({
selector: 'app-root',
templateUrl: './app.component.html',
styleUrls: ['./app.component.css']
})
export class AppComponent {
title = 'GFG';
basicData = {
labels: ['Sunday', 'Monday', 'Tuesday', 'Wednesday',
'Thursday', 'Friday', 'Saturday'],
datasets: [
{
label: 'Booked',
backgroundColor: 'green',
data: [66, 49, 81, 71, 26, 65, 60]
},
]
};
basicOptions = {
plugins: {
legend: {
labels: {
color: '#black'
}
}
},
scales: {
x: {
ticks: {
color: '#black'
},
grid: {
color: 'rgba(255,255,255,0.2)'
}
},
y: {
ticks: {
color: '#black'
},
grid: {
color: 'rgba(255,255,255,0.2)'
}
}
}
};
}
|
Javascript
import { NgModule } from '@angular/core';
import { BrowserModule }
from '@angular/platform-browser';
import { AppComponent } from './app.component';
import { ChartModule } from 'primeng/chart';
@NgModule({
declarations: [
AppComponent,
],
imports: [
BrowserModule,
ChartModule
],
providers: [],
bootstrap: [AppComponent]
})
export class AppModule { }
|
Output:
Example 2: This example describes the basic usage of the BarChart Vertical in Angular PrimeNG. Here, we will display 2 data sets together vertically
HTML
<div id="GFG">
<h1 style="color:green">GeeksforGeeks</h1>
<h2>Angular PrimeNG Bar Chart Vertical</h2>
<div style="width:70%;">
<p-chart type="bar"
[data]="basicData"
[options]="basicOptions">
</p-chart>
</div>
</div>
|
Javascript
import { Component } from '@angular/core';
@Component({
selector: 'app-root',
templateUrl: './app.component.html',
styleUrls: ['./app.component.css']
})
export class AppComponent {
title = 'GFG';
basicData = {
labels: ['Sunday', 'Monday', 'Tuesday', 'Wednesday',
'Thursday', 'Friday', 'Saturday'],
datasets: [
{
label: 'Booked',
backgroundColor: '#42A5F5',
data: [66, 49, 81, 71, 26, 65, 60]
},
{
label: 'Cancelled ',
backgroundColor: '#FFA726',
data: [68, 18, 60, 79, 16, 47, 80]
}
]
};
basicOptions = {
plugins: {
legend: {
labels: {
color: '#black'
}
}
},
scales: {
x: {
ticks: {
color: '#black'
},
grid: {
color: 'rgba(255,255,255,0.2)'
}
},
y: {
ticks: {
color: '#black'
},
grid: {
color: 'rgba(255,255,255,0.2)'
}
}
}
};
}
|
Javascript
import { NgModule } from '@angular/core';
import { BrowserModule }
from '@angular/platform-browser';
import { AppComponent } from './app.component';
import { ChartModule } from 'primeng/chart';
@NgModule({
declarations: [
AppComponent,
],
imports: [
BrowserModule,
ChartModule
],
providers: [],
bootstrap: [AppComponent]
})
export class AppModule { }
|
Output:
Reference: http://primefaces.org/primeng/chart/bar
Share your thoughts in the comments
Please Login to comment...