Compute Cumulative Log Normal Probability Density in R Programming – plnorm() Function
Last Updated :
25 Jun, 2020
plnorm() function in R Language is used to compute the log normal value of the cumulative probability density function. It also creates a plot of the cumulative distribution of log normal density.
Syntax: plnorm(vec)
Parameters:
vec: x-values for normal density
Example 1:
x <- seq(1, 10, by = 1)
y <- plnorm(x)
y
|
Output:
 [1] 0.5000000 0.7558914 0.8640314 0.9171715 0.9462397 0.9634142 0.9741672
 [8] 0.9812116 0.9859978 0.9893489
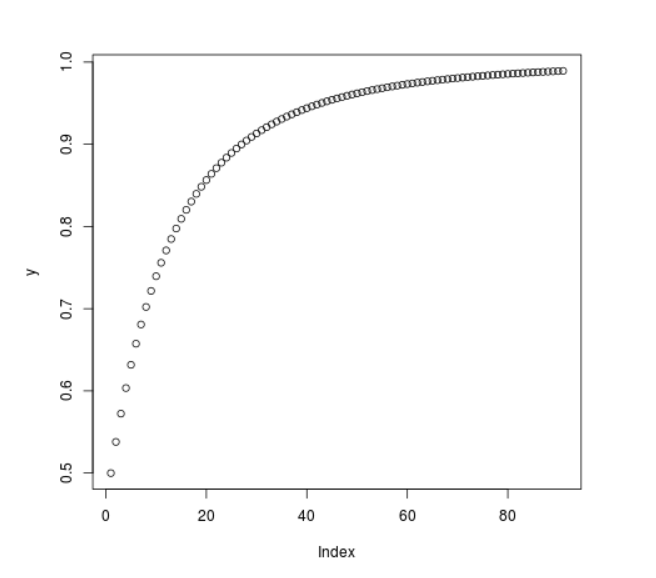
Example 2:
x <- seq(1, 10, by = 0.1)
y <- plnorm(x)
plot(y)
|
Output:
Share your thoughts in the comments
Please Login to comment...