Matplotlib.artist.Artist.update_from() in Python
Last Updated :
10 May, 2020
Matplotlib is a library in Python and it is numerical – mathematical extension for NumPy library. The Artist class contains Abstract base class for objects that render into a FigureCanvas. All visible elements in a figure are subclasses of Artist.
matplotlib.artist.Artist.update_from() method
The update_from() method in artist module of matplotlib library is used to copy properties from other to self.
Syntax: Artist.update_from(self, other )
Parameters: This method accepts the following parameters.
- other : This parameter is the property to be updated.
Returns: This method return dictionary of all the properties of the artist.
Below examples illustrate the matplotlib.artist.Artist.update_from() function in matplotlib:
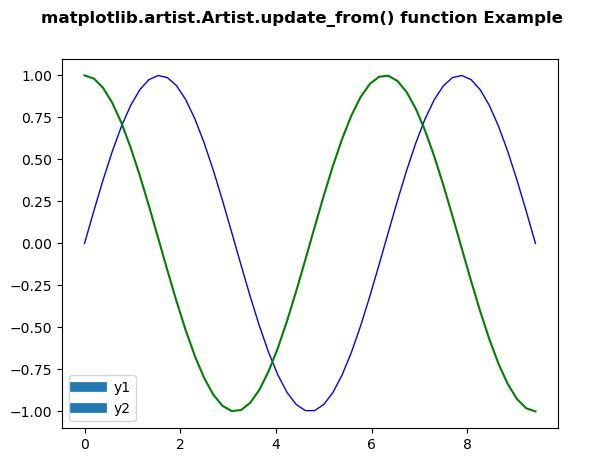
Example 1:
from matplotlib.artist import Artist
import numpy as np
import matplotlib.pyplot as plt
from matplotlib.legend_handler import HandlerLine2D
x = np.linspace(0, 3 * np.pi)
y1 = np.sin(x)
y2 = np.cos(x)
fig = plt.figure()
ax = fig.add_subplot(111)
ax.plot(x, y1, c ='b', label ='y1', linewidth = 1.0)
ax.plot(x, y2, c ='g', label ='y2')
linewidth = 7
def update(prop1, prop2):
Artist.update_from(prop1, prop2)
prop1.set_linewidth(7)
plt.legend(handler_map ={plt.Line2D : HandlerLine2D(update_func = update)})
fig.suptitle('matplotlib.artist.Artist.update()\
function Example', fontweight ="bold")
plt.show()
|
Output:
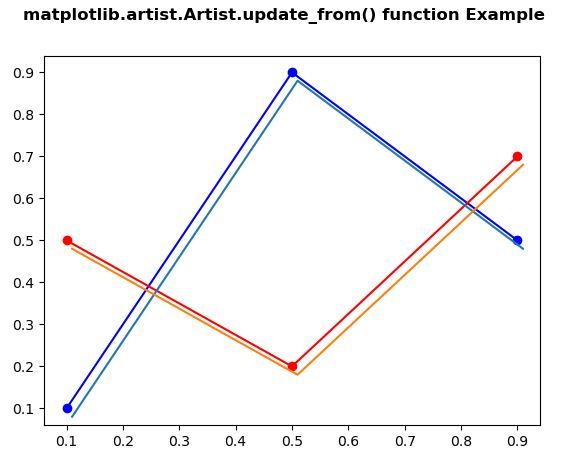
Example 2:
from matplotlib.artist import Artist
import numpy as np
import matplotlib.pyplot as plt
import matplotlib.transforms as mtransforms
fig, ax = plt.subplots()
l1, = ax.plot([0.1, 0.5, 0.9],
[0.1, 0.9, 0.5],
"bo-")
l2, = ax.plot([0.1, 0.5, 0.9],
[0.5, 0.2, 0.7],
"ro-")
for l in [l1, l2]:
xx = l.get_xdata()
yy = l.get_ydata()
shadow, = ax.plot(xx, yy)
Artist.update_from(shadow, l)
ot = mtransforms.offset_copy(l.get_transform(),
ax.figure,
x = 4.0,
y =-6.0,
units ='points')
shadow.set_transform(ot)
fig.suptitle('matplotlib.artist.Artist.update_from()\
function Example', fontweight ="bold")
plt.show()
|
Output:
Share your thoughts in the comments
Please Login to comment...