What is a Network Diagram in Project Management?
Last Updated :
23 Apr, 2024
A network diagram is a visual representation of project tasks and their dependencies, crucial in project management for planning and scheduling. It illustrates the flow of work, sequence of tasks, and relationships between them, aiding project managers in understanding project complexity and optimizing resource allocation. By providing a clear overview of the project structure, network diagrams facilitate effective communication, decision-making, and risk management throughout the project lifecycle.
What is a Project Network?
A project network is the interconnected framework of tasks and activities within a project, illustrating their sequence, dependencies, and interrelations. It visually demonstrates how various project components link together and contribute to achieving project goals. Project networks are typically portrayed through diagrams like PERT or CPM charts, aiding project managers in efficiently planning, scheduling, and overseeing project endeavors.
What is a Project Schedule Network Diagram?
A project schedule network diagram depicts the chronological and logical relationships between tasks in a project scenario. This visualization is based on a clear depiction of the chronology of tasks and occurrences. A project network diagram is typically depicted as a chart with boxes and arrows. This network diagram tool is used to plan the project’s schedule and work order, as well as follow its progress through each step, including completion. A network diagram is also effective in displaying the breadth of the project because it includes all of the large tasks that must be completed during the project.
Components of a Project Schedule Network Diagram:
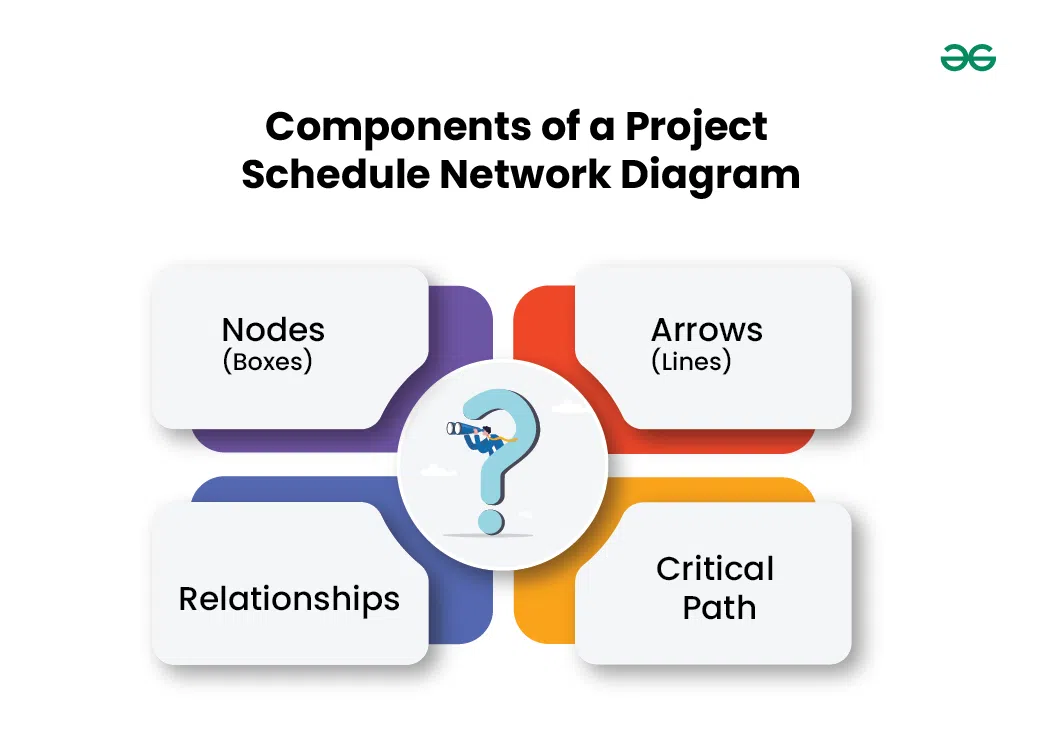
Components of a Project Schedule Network Diagram
- Nodes (Boxes): Nodes represent project activities or tasks. Each node contains information such as the activity name, duration, resources, and any other relevant details.
- Arrows (Lines): Arrows represent dependencies between activities. They show the logical sequence in which activities must be performed. The direction of the arrow indicates the flow of work.
- Relationships: There are four types of relationships between activities:
- Finish-to-Start (FS): The successor activity cannot start until the predecessor activity finishes.
- Start-to-Start (SS): The successor activity cannot start until the predecessor activity starts.
- Finish-to-Finish (FF): The successor activity cannot finish until the predecessor activity finishes.
- Start-to-Finish (SF): The successor activity cannot finish until the predecessor activity starts.
- Critical Path: The critical path is the longest sequence of dependent activities that determine the shortest possible duration for completing the project. Activities on the critical path have zero slack or float time, meaning any delay in these activities will directly impact the project’s overall timeline.
Types of Project Network Diagrams
In project management, there are two types of network diagrams: the arrow diagramming method (ADM), also known as “activity network diagram” or “activity on arrow“; and the precedence diagramming method (PDM), also known as “node network” or “activity on node.”

Types of Project Network Diagrams
1. Arrow diagram method (ADM)
The ADM, or activity network diagram, depicts project-related activities using arrows. It is crucial to note that, due to its limitations, the ADM is no longer commonly utilized in project management. However, understanding ADMs will help you recognize them if they appear in your workplace.

In ADM:
- The tail of the arrow signifies the beginning of the action, while the head represents the end.
- The length of the arrow often represents the duration of the action.
- Each arrow connects two boxes, called “nodes.” Nodes are used to indicate the beginning or end of an activity in a sequence. The initial node of an activity is sometimes referred to as the “i-node,” whereas the last node of a sequence is sometimes referred to as the “j-node.”
- The only relationship between nodes and activity that an ADM chart may indicate is “finish to start” (FS).
In some cases, ADM network diagrams require the inclusion of “dummy activities” to represent indirect relationships. For instance, if activity C can only start after both activities A and B are finished, but A and B are not directly related, a dummy activity is added between B and C to show this dependency. For example, if pouring concrete (activity A) and obtaining permits (activity B) are prerequisites for tiling a floor (activity C), a dummy activity would illustrate the connection between B and C. Additionally, ADM charts lack a built-in mechanism for incorporating lead and lag times without introducing new nodes and activities.
2. Precedence diagram method (PDM)
In contemporary project management, PDM network diagrams are commonly employed, offering a streamlined substitute for ADMs. In the Precedence Diagramming Method, each node signifies an activity, while arrows depict relationships between them. These arrows symbolize all four potential connections: “Finish to Start” (FS), “Start to Start” (SS), “Finish to Finish” (FF), and “Start to Finish” (SF).
.png)
- “Finish to Start” (FS): When an activity cannot start before another activity finishes
- “Start to Start” (SS): When two activities can start simultaneously
- “Finish to Finish” (FF): When two tasks need to finish together
- “Start to Finish” (SF): This is an uncommon dependency and is only used when one activity cannot finish until another activity starts
PDM allows you to write lead and lag times beside the arrows. If a given action will take 10 days to complete before the following activity can begin, for example, you may simply put “10 days” over the arrow expressing the relationship between the related nodes.
Related Articles:
Conclusion: Network Diagram in Project Management
In conclusion, project network diagrams, whether using the arrow diagram method (ADM) or the precedence diagram method (PDM), are invaluable tools in project management. They provide a visual representation of project tasks, dependencies, and workflows, aiding in planning, scheduling, and communication. By understanding and utilizing these diagrams effectively, project managers can streamline processes, track progress, and ensure successful project outcomes.
FAQs: Network Diagram in Project Management
What is a project network diagram?
A project network diagram is a visual representation of project tasks and their dependencies, aiding in planning and scheduling.
How do project network diagrams benefit project managers?
Project network diagrams provide a clear overview of project structure, aiding in understanding complexity, optimizing resource allocation, and facilitating effective communication and decision-making.
What are the types of project network diagrams?
The types of project network diagrams include the arrow diagram method (ADM) and the precedence diagram method (PDM).
How does the arrow diagram method (ADM) differ from the precedence diagram method (PDM)?
ADM depicts project activities using arrows, while PDM represents activities as nodes connected by arrows, symbolizing different types of task relationships.
Why are lead and lag times important in project scheduling?
Lead and lag times indicate delays or advances between connected activities, facilitating precise scheduling and ensuring tasks are completed in the correct sequence.
Share your thoughts in the comments
Please Login to comment...