sympy.stats.LogNormal() in python
Last Updated :
05 Jun, 2020
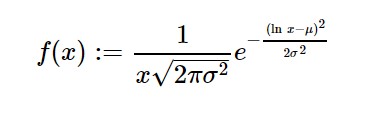
With the help of sympy.stats.LogNormal() method, we can get the continuous random variable which represents the Log-Normal distribution.
Syntax : sympy.stats.LogNormal(name, mean, std)
Where, mean and standard deviation are real number.
Return : Return the continuous random variable.
Example #1 :
In this example we can see that by using sympy.stats.LogNormal() method, we are able to get the continuous random variable representing Log-Normal distribution by using this method.
from sympy.stats import LogNormal, density
from sympy import Symbol, pprint
z = Symbol("z")
mean = Symbol("mean", positive = True)
std = Symbol("std", positive = True)
X = LogNormal("x", mean, std)
gfg = density(X)(z)
pprint(gfg)
|
Output :
2
-(-mean + log(z))
——————-
2
___ 2*std
\/ 2 *e
————————–
____
2*\/ pi *std*z
Example #2 :
from sympy.stats import LogNormal, density
from sympy import Symbol, pprint
z = 2.1
mean = 7.6
std = 4
X = LogNormal("x", mean, std)
gfg = density(X)(z)
pprint(gfg)
|
Output :
0.0136890249307238*\/ 2
————————
____
\/ pi
Share your thoughts in the comments
Please Login to comment...