To begin with, statistical function in Excel let’s first understand what is statistics and why we need it? So, statistics is a branch of sciences that can give a property to a sample. It deals with collecting, organizing, analyzing, and presenting the data. One of the great mathematicians Karl Pearson, also the father of modern statistics quoted that, “statistics is the grammar of science”.
We used statistics in every industry, including business, marketing, governance, engineering, health, etc. So in short statistics a quantitative tool to understand the world in a better way. For example, the government studies the demography of his/her country before making any policy and the demography can only study with the help of statistics. We can take another example for making a movie or any campaign it is very important to understand your audience and there too we used statistics as our tool.
Ways to approach statistical function in Excel:
In Excel, we have a range of statical functions, we can perform basic mead, median mode to more complex statistical distribution, and probability test. In order to understand statistical Functions we will divide them into two sets:
- Basic statistical Function
- Intermediate Statistical Function.
Statistical Function in Excel
Excel is the best tool to apply statistical functions. As discussed above we first discuss the basic statistical function, and then we will study intermediate statistical function. Throughout the article, we will take data and by using it we will understand the statistical function.
So, let’s take random data of a book store that sells textbooks for classes 11th and 12th.
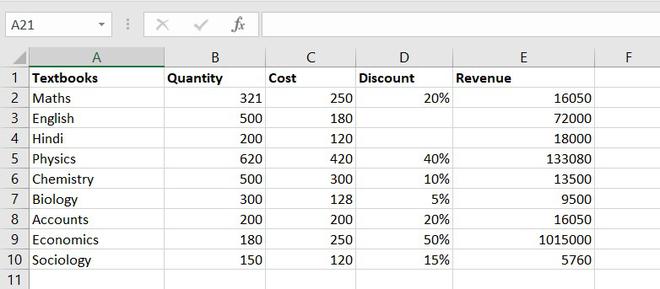
Example of statistical function.
Basic statistical Function
These are some most common and useful functions. These include the COUNT function, COUNTA function, COUNTBLANK function, COUNTIFS function. Let’s discuss one by one:
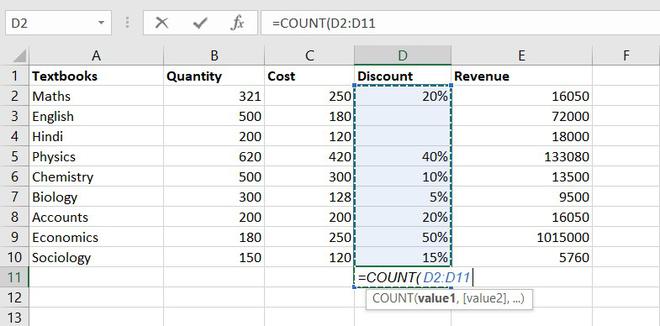
1. COUNT function
The COUNT function is used to count the number of cells containing a number. Always remember one thing that it will only count the number.
Formula for COUNT function = COUNT(value1, [value2], …)
Example of statistical function.
Thus, there are 7 textbooks that have a discount out of 9 books.
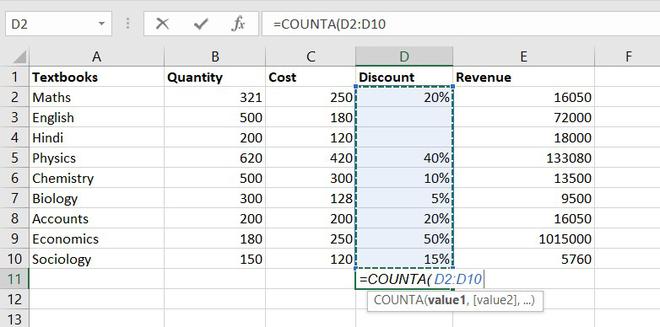
2. COUNTA function
This function will count everything, it will count the number of the cell containing any kind of information, including numbers, error values, empty text.
Formula for COUNTA function = COUNTA(value1, [value2], …)
Example of statistical function.
So, there are a total of 9 subjects that being sold in the store
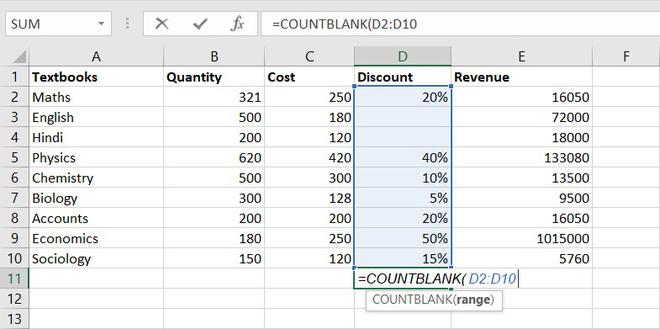
3. COUNTBLANK function
COUNTBLANK function, as the term, suggest it will only count blank or empty cells.
Formula for COUNTBlANK function = COUNTBLANK(range)
Example of statistical function.
There are 2 subjects that don’t have any discount.
4. COUNTIFS function
COUNTIFS function is the most used function in Excel. The function will work on one or more than one condition in a given range and counts the cell that meets the condition.
Formula for COUNTIFS function = COUNTIFS (range1, criteria1, [range2], [criteria2], ...)
Intermediate Statistical Function
Let’s discuss some intermediate statistical functions in Excel. These functions used more often by the analyst. It includes functions like AVERAGE function, MEDIAN function, MODE function, STANDARD DEVIATION function, VARIANCE function, QUARTILES function, CORRELATION function.
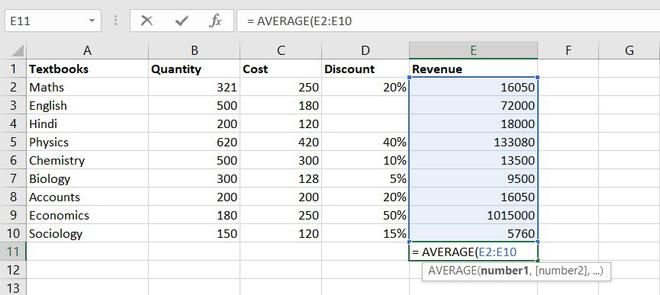
1. AVERAGE value1, [value2], …)
The AVERAGE function is one of the most used intermediate functions. The function will return the arithmetic mean or an average of the cell in a given range.
Formula for AVERAGE function = AVERAGE(number1, [number2], …)
Example of statistical function.
So the average total revenue is Rs.144326.6667
2. AVERAGEIF function
The function will return the arithmetic mean or an average of the cell in a given range that meets the given criteria.
Formula for AVERAGEIF function = AVERAGEIF(range, criteria, [average_range])
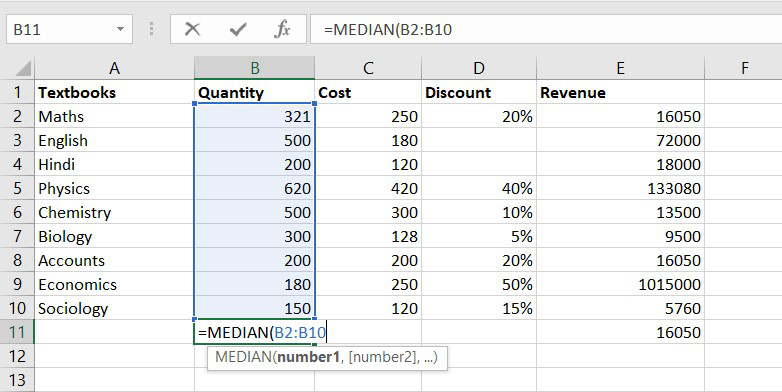
3. MEDIAN function
The MEDIAN function will return the central value of the data. Its syntax is similar to the AVERAGE function.
Formula for MEDIAN function = MEDIAN(number1, [number2], …)
Example of statistical function.
Thus, the median quantity sold is 300.
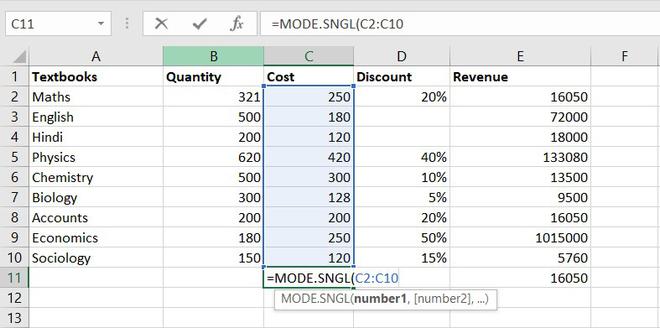
4. MODE function
The MODE function will return the most frequent value of the cell in a given range.
Formula for MODE function = MODE.SNGL(number1,[number2],…)
Example of statistical function.
Thus, the most frequent or repetitive cost is Rs. 250.
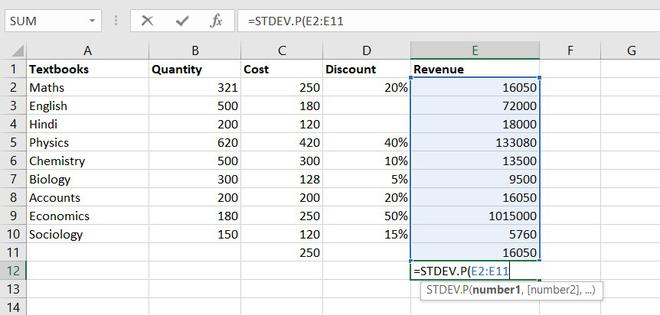
5. STANDARD DEVIATION
This function helps us to determine how much observed value deviated or varied from the average. This function is one of the useful functions in Excel.
Formula for STANDARD DEVIATION function = STDEV.P(number1,[number2],…)
Example of statistical function.
Thus, Standard Deviation of total revenue =296917.8172
6. VARIANCE function
To understand the VARIANCE function, we first need to know what is variance? Basically, Variance will determine the degree of variation in your data set. The more data is spread it means the more is variance.
Formula for VARIANCE function = VAR(number1, [number2], …)
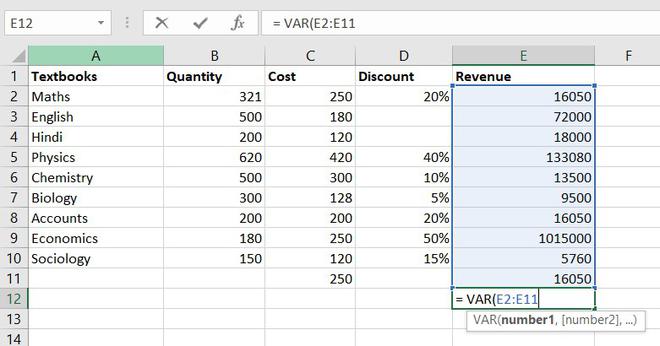
Example of statistical function.
So, the variance of Revenue= 97955766832
7. QUARTILES function
Quartile divides the data into 4 parts just like the median which divides the data into two equal parts. So, the Excel QUARTILES function returns the quartiles of the dataset. It can return the minimum value, first quartile, second quartile, third quartile, and max value. Let’s see the syntax :
Formula for QUARTILES function = QUARTILE (array, quart)
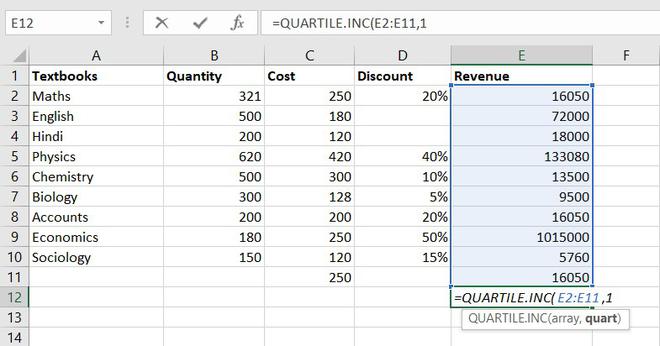
Example of statistical function.
So, the first quartile = 14137.5
8. CORRELATION function
CORRELATION function, help to find the relationship between the two variables, this function mostly used by the analyst to study the data. The range of the CORRELATION coefficient lies between -1 to +1.
Formula for CORRELATION function = CORREL(array1, array2)
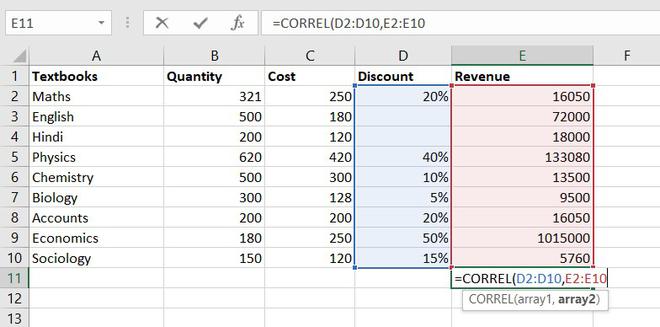
Example of statistical function.
So, the correlation coefficient between discount and revenue of store = 0.802428894. Since it is a positive number, thus we can conclude discount is positively related to revenue.
9. MAX function
The MAX function will return the largest numeric value within a given set of data or an array.
Formula for MAX function = MAX (number1, [number2], ...)
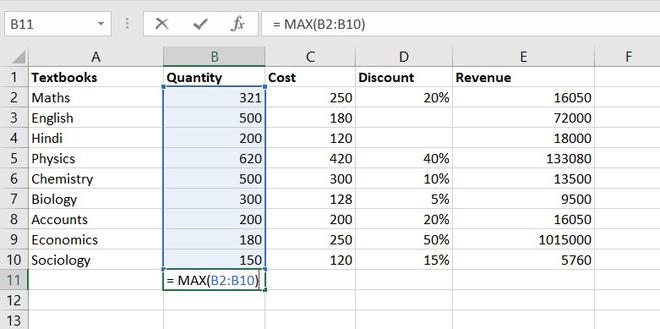
The maximum quantity of textbooks is Physics,620 in numbers.
10. MIN function
The MIN function will return the smallest numeric value within a given set of data or an array.
Formula for MIN function = MIN (number1, [number2], ...)
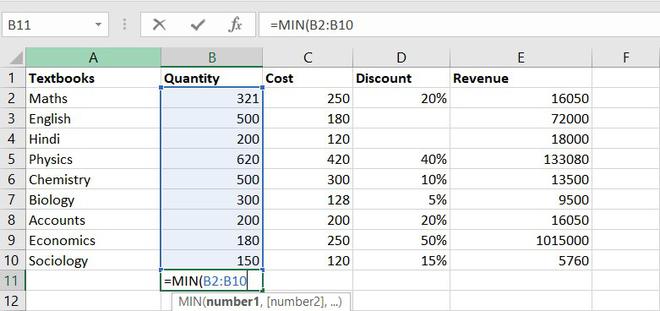
The minimum number of the book available in the store =150(Sociology)
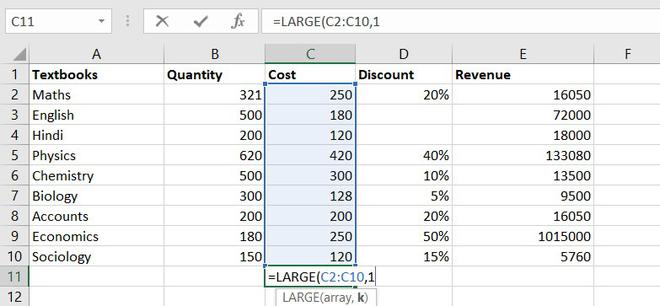
11. LARGE function
The LARGE function is similar to the MAX function but the only difference is it returns the nth largest value within a given set of data or an array.
Formula for LARGE function = LARGE (array, k)
Let’s find the most expensive textbook using a large function, where k = 1
Example of statistical function.
The most expensive textbook is Rs. 420.
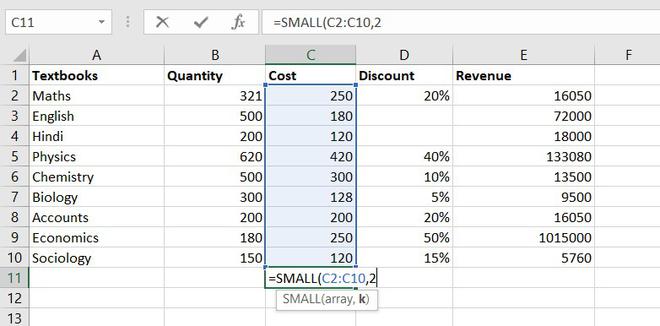
12. SMALL function
The SMALL function is similar to the MIN function, but the only difference is it return nth smallest value within a given set of data or an array.
Formula for SMALL function = SMALL (array, k)
Similarly, using the SMALL function we can find the second least expensive book.
Example of statistical function.
Thus, Rs. 120 is the least cost price.
Conclusion
So these are some statistical functions of Excel. We have learned some of the most simple functions like COUNT functions to complex ones like the CORRELATION function. So far we learn, we understand how much these functions are useful for analyzing any data. You can explore more functions and learn more things of your own.
Share your thoughts in the comments
Please Login to comment...