seaborn.crayon_palette Method()
Last Updated :
29 Apr, 2024
Seaborn is a Python data visualization library based on Matplotlib. It provides a high-level interface for drawing attractive and informative statistical graphics. There is just something extraordinary about a well-designed visualization. In this article we will learn about the Python seaborn.crayon_palette Method().
What is seaborn.crayon_palette() Method?
The seaborn.crayon_palette() method is used to generate color palettes from color names. The method expects the color names provided to be one of the 120 colors from the Crayola color palette.
Syntax:
seaborn.crayon_palette(colours)
Parameters: colours: A list of string defining colour names
Returns: A list of tuples defining RGB combination of the colours.
Python seaborn.crayon_palette Method() Example
Below, are the Python seaborn.crayon_palette Method() examples.
- Colorful Bar Plot
- Random Scatter Plot
- Colorful Heatmap
Create Colorful Bar Plot Using seaborn.crayon_palette() Method
In this example, below code generates a colorful bar plot depicting the frequencies of different colors. It utilizes a custom color palette created with Seaborn’s crayon_palette function. The barplot visually represents the frequencies of each color.
Python3
import seaborn as sns
import matplotlib.pyplot as plt

colors = ['Red', 'Blue', 'Green', 'Yellow', 'Orange']
frequency = [20, 15, 25, 18, 12]

palette = sns.crayon_palette(colors)

sns.barplot(x=colors, y=frequency, palette=palette)
plt.show()
Output:

Bar Plot
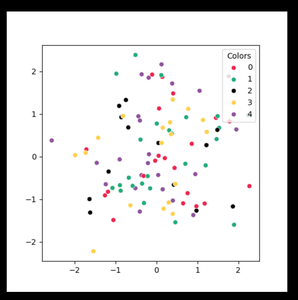
Create Random Scatter Plot Using seaborn.crayon_palette() Method
In this example, code uses NumPy and Seaborn to generate a scatter plot with random data. It assigns random colors to data points and utilizes a custom color palette. The legend provides a visual guide to the colors used in the plot.
Python3
import numpy as np
import seaborn as sns

np.random.seed(0)
x = np.random.randn(100)
y = np.random.randn(100)
colors = np.random.randint(0, 5, 100)

palette = sns.crayon_palette(['Red', 'Green', 'Black', 'Sunglow', 'Vivid Violet'])

sns.scatterplot(x=x, y=y, hue=colors, palette=palette)
plt.legend(title='Colors', loc='upper right')
plt.show()
Output:
Create Colorful Heatmap Using seaborn.crayon_palette() Method
In this example, below code creates a heatmap using NumPy and Seaborn libraries, with random data arranged in a 10×10 matrix. It applies a custom color palette using Seaborn’s crayon_palette function, resulting in a visually appealing representation of the data.
Python3
import numpy as np
import seaborn as sns

np.random.seed(0)
data = np.random.rand(10, 10)

palette = sns.crayon_palette(['Red', 'Blue', 'Green', 'Yellow', 'Orange'])

sns.heatmap(data, cmap=palette, cbar=True)
plt.show()
Output

Heatmap Plot
Share your thoughts in the comments
Please Login to comment...