Python | Pandas dataframe.corrwith()
Last Updated :
16 May, 2020
Python is a great language for doing data analysis, primarily because of the fantastic ecosystem of data-centric python packages. Pandasis one of those packages and makes importing and analyzing data much easier.
Pandas dataframe.corrwith() is used to compute pairwise correlation between rows or columns of two DataFrame objects. If the shape of two dataframe object is not same then the corresponding correlation value will be a NaN value.
Syntax: DataFrame.count(axis=0, level=None, numeric_only=False)
Parameters:
other : DataFrame
axis : 0 or ‘index’ to compute column-wise, 1 or ‘columns’ for row-wise
drop : Drop missing indices from result, default returns union of all
Returns: correls : Series
Note: The correlation of a variable with itself is 1.
Example #1: Use corrwith() function to find the correlation among two dataframe objects along the column axis
import pandas as pd
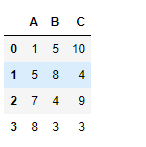
df1 = pd.DataFrame({"A":[1, 5, 7, 8],
"B":[5, 8, 4, 3],
"C":[10, 4, 9, 3]})
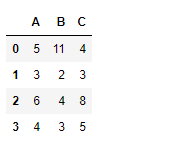
df2 = pd.DataFrame({"A":[5, 3, 6, 4],
"B":[11, 2, 4, 3],
"C":[4, 3, 8, 5]})
print(df1, "\n")
print(df2)
|
Now find the correlation among the columns of the two data frames along the row axis.
df1.corrwith(df2, axis = 0)
|
Output :
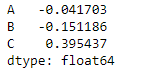
The output series contains the correlation between the three columns of two dataframe objects respectively.
Example #2: Use corrwith() function to find the correlation among two dataframe objects along the row axis
import pandas as pd
df1 = pd.DataFrame({"A":[1, 5, 7, 8],
"B":[5, 8, 4, 3],
"C":[10, 4, 9, 3]})
df2 = pd.DataFrame({"A":[5, 3, 6, 4],
"B":[11, 2, 4, 3],
"C":[4, 3, 8, 5]})
df1.corrwith(df2, axis = 1)
|
Output :
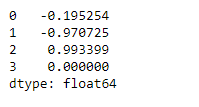
The output series contains the correlation between the four rows of two data frame objects respectively.
Share your thoughts in the comments
Please Login to comment...