plotly.express.line() function in Python
Last Updated :
20 Jul, 2020
Plotly library of Python can be very useful for data visualization and understanding the data simply and easily. Plotly graph objects are a high-level interface to plotly which are easy to use.
plotly.express.line() function
This function is used to create a line plot. It can also be created using the pandas dataframe where each row of data_frame is represented as vertex of a polyline mark in 2D space.
Syntax: plotly.express.line(data_frame=None, x=None, y=None, line_group=None, color=None, line_dash=None, hover_name=None, hover_data=None, title=None, template=None, width=None, height=None)
Parameters:
data_frame: DataFrame or array-like or dict needs to be passed for column names.
x, y: This parameters is either a name of a column in data_frame, or a pandas Series or array_like object. Values from this column or array_like are used to position marks along the x and y axis in cartesian coordinates respectively.
color: This parameters assign color to marks.
line_group: This parameter is used to group rows of data_frame into lines.
line_dash: This parameter is used to assign dash-patterns to lines.
hover_name: Values from this column or array_like appear in bold in the hover tooltip.
hover_data: This parameter is used to appear in the hover tooltip or tuples with a bool or formatting string as first element, and list-like data to appear in hover as second element Values from these columns appear as extra data in the hover tooltip.
Example 1:
Python3
import plotly.express as px
df = px.data.tips()
plot = px.line(df, x = 'day', y = 'time')
plot.show()
|
Output:

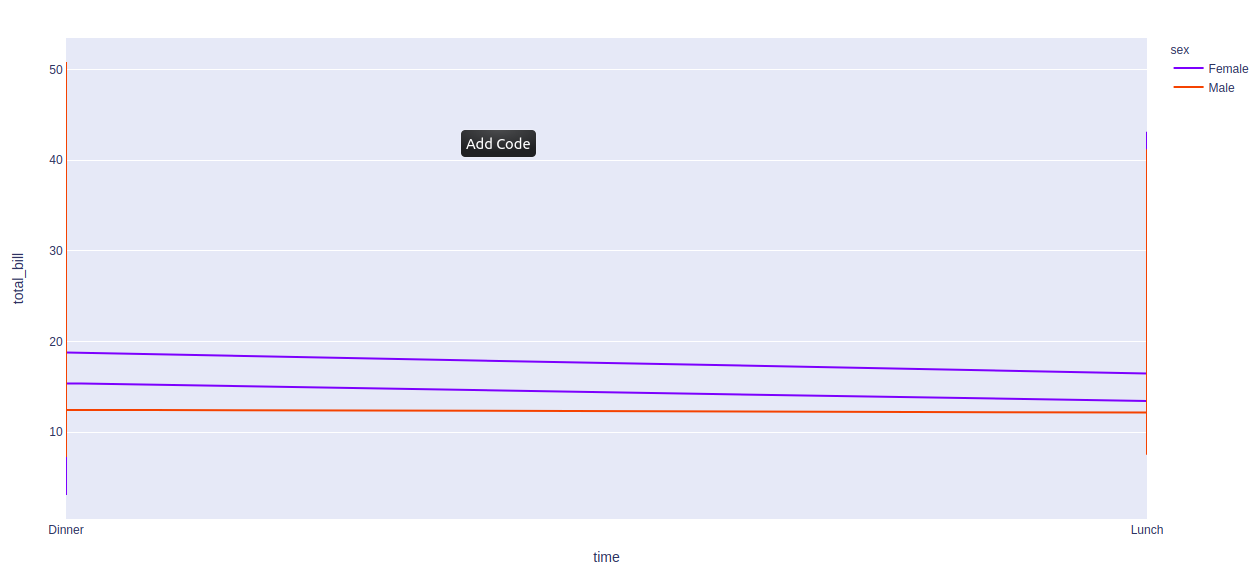
Example 2: Using color argument
Python3
import plotly.express as px
df = px.data.tips()
plot = px.line(df, x = 'time',
y = 'total_bill',
color = 'sex')
plot.show()
|
Output:

Example 3: Using the line_group argument
Python3
import plotly.express as px
df = px.data.tips()
plot = px.line(df, x = 'time',
y = 'total_bill',
color = 'sex',
line_group = 'day')
plot.show()
|
Output:
Share your thoughts in the comments
Please Login to comment...