How to Use Azure Monitor to Observe and Diagnose a JavaScript Error?
Last Updated :
19 Sep, 2023
JavaScript is a very versatile language but still errors can occur, main to sudden conduct and personal dissatisfaction. Microsoft Azure offers an effective device referred to as Azure Monitor, which allows developers to identify, look at, and diagnose JavaScript errors effectively. In this text, we will explore how to use Azure Monitor to display, stumble on, and solve JavaScript mistakes in Azure-based total packages.
What is Azure Monitor
Azure Monitor is a comprehensive tracking and control answer provided by using Microsoft Azure for monitoring the overall performance, health, and availability of applications, infrastructure, and services for your Azure surroundings. It offers a set of equipment and functions that help you acquire telemetry information, benefit insights into your resources’ conduct, and take proactive movements to make sure optimum performance and reliability.
Azure Monitor performs a crucial function in maintaining the reliability and overall performance of packages and offerings hosted within the Azure cloud. It facilitates corporations become aware of and deal with troubles early, providing a higher experience for users and allowing greater green useful resource control.
Key Features and Abilities of Azure Monitor
- Telemetry Collection: Azure Monitor collects telemetry statistics from various assets, which include programs, virtual machines, containers, and different Azure offerings. This data includes metrics, logs, traces, and other relevant data that offer insights into the conduct of your resources.
- Logs and Diagnostics: Azure Monitor provides log collection and evaluation capabilities via Azure Monitor Logs (formerly called Log Analytics). This feature enables you to centralize logs from exclusive resources, query the facts the use of a effective question language, and installation signals based totally on log activities.
- Application Insights: Part of Azure Monitor, Application Insights is a tool designed mainly for tracking the overall performance of packages. It permits you to music consumer interactions, diagnose performance troubles, and perceive traits the use of statistics together with requests, dependencies, and exceptions.
- Alerts and Notifications: Azure Monitor permits you to create and configure signals based totally on metrics and log information. When situations meet unique thresholds, indicators can trigger notifications thru diverse channels like e-mail, SMS, and integrations with communique platforms.
- Auto-scaling: By the use of insights from Azure Monitor, you can implement car-scaling techniques. Azure can dynamically regulate the potential of your sources based totally on factors like CPU usage or reaction times, ensuring most excellent performance even as minimizing fees.
What is Microsoft Azure?
Microsoft Azure affords an entire monitoring solution called Azure Monitor. It permits programmers to gather, look at, and take motion on telemetry records from special Azure resources and apps. Azure Monitor is an important tool for ensuring the quality and overall performance of your packages as it allows for the monitoring of software’s overall performance, infrastructure health, and other facts.
How to Enable Azure Monitor for JavaScript Error Monitoring?
To begin tracking JavaScript errors on your Azure-primarily based programs, comply with the steps:
Create an Application Insights: Azure Monitor has a device called Application Insights that video display units the overall performance of programs. Begin by creating an Application Insights aid within the Azure portal.
1. Click on Application Button
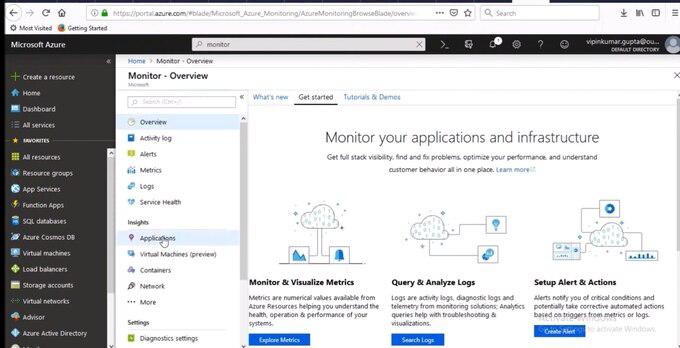
Click on Application Button
2. Create an application insight

Create an application insight
3. Give a unique name for your Application Insights resource
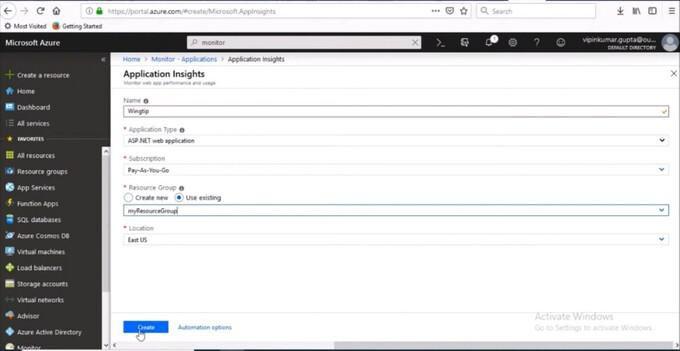
Give a unique name f
Instrument your JavaScript utility: Integrate the Application Insights JavaScript SDK into your web utility. It may be used in numerous JavaScript frameworks and libraries like React, Angular, or simple JavaScript.
1. Add application insight
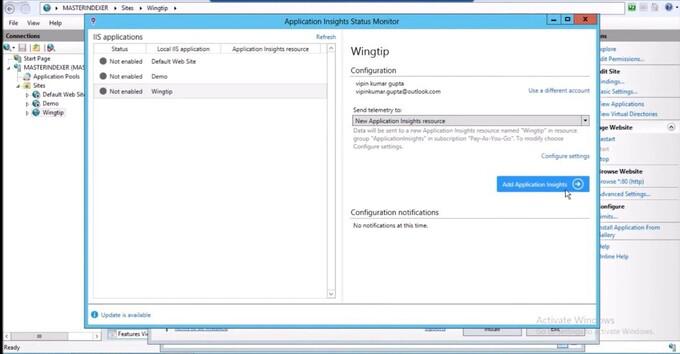
Add application insight
Configure error tracking: Once you’ve got instrumented your software, configure error monitoring to display JavaScript mistakes. The SDK will mechanically acquire statistics about unhandled exceptions and JavaScript errors.

Configure error tracking
Monitor Your application Insight: . Once your application is instrumented and actively sending telemetry data to Application Insights

Monitor Your application Insight
How to Identify JavaScript Errors in Azure Monitor?
Azure Monitor affords diverse tools and dashboards to become aware of and study JavaScript mistakes correctly:
- Application Insights Overview Dashboard: It will provide you with an outline of the number of JavaScript errors, the affected customers, and their locations.
- Failures Blade: The Failures Blade gives exact information approximately failed requests, along with JavaScript errors.
- Performance Blade: The Performance Blade facilitates you analyze the performance of your utility and detect any correlation among performance troubles and JavaScript mistakes.
How to Resolve JavaScript Errors?
- Detailed mistakes records: Application Insights captures distinctive errors records, together with the error message, stack hint, and affected users. This records is vital for knowledge the root reason of the error.
- Alerts and Notifications: Configure alerts to be notified when the number of JavaScript errors exceeds a targeted threshold. It can deliver notification via any medium like Email, SMS and so on.
- Continuous Improvement: Continuously examine the JavaScript errors statistics to perceive styles and recurring troubles.
Performance Optimization Techniques
Optimizing your utility’s performance can lessen the prevalence of JavaScript mistakes:
- Minification and compression: By minimizing the quantity of your JavaScript code, you may speed up page masses and lessen the chance that mistakes will get up because of slow community connections.
- Caching Techniques: Use caching techniques for your JavaScript documents to lessen server queries and improve the responsiveness of the utility.
- Browser Compatibility: Test your utility throughout many browsers and browser variations to make certain JavaScript problems are not unique to particular setups.
Best Practices and Tips
Here are some best practices and guidelines for efficiently using Azure Monitor to take a look at and diagnose JavaScript mistakes:
- Enable Detailed Error Tracking: Ensure that you permit specified mistakes tracking inside the Application Insights SDK for JavaScript. This putting permits you to seize stack traces and additional context information, making it less difficult to diagnose and fasten JavaScript mistakes as it should be.
- Set Realistic Alert Thresholds: When configuring alerts for JavaScript mistakes, set alert thresholds which are realistic and applicable to your software’s overall performance. Setting thresholds too low may generate excessive fake indicators, while placing them too excessive may want to cause essential errors being disregarded.
- Monitor Error Rates over Time: Keep a close eye on the fashion of JavaScript blunders fees over the years. This will assist you identify any increasing developments or styles that can require immediate attention.
- Utilize Smart Detection: Leverage Azure Monitor’s Smart Detection characteristic to automatically hit upon anomalies in your utility’s conduct. This allow you to proactively pick out JavaScript mistakes and different problems before they turn out to be considerable.
Conclusion
Monitoring and diagnosing JavaScript mistakes the usage of Azure Monitor and Application Insights provide precious insights into your software’s health and user revel in. You can efficaciously pick out, hint, and rectify JavaScript issues through making use of Azure Monitor’s study analytics and diagnostic equipment. A extra constant and dependable consumer enjoy will result from performance optimization on your software, for you to also decrease the frequency of JavaScript error.
Frequently Asked Questions
1. What sort of JavaScript errors Azure Monitor detect?
Azure Monitor can detect numerous kinds of JavaScript errors, consisting of unhandled exceptions, runtime errors, and syntax errors. It captures errors information like error messages, stack lines, affected customers, and more.
2. How does Azure Monitor help me identify the impact of JavaScript errors on users?
Azure Monitor offers insights into the wide variety of affected customers, their places, and the specific mistakes encountered. With this statistics, you can prioritize fixes and upgrades based on consumer impact.
3. Can I set up alerts for JavaScript errors the use of Azure Monitor?
Yes, you may set up alerts based totally on thresholds for JavaScript errors. Azure Monitor permits you to configure signals to receive notifications through diverse channels like e-mail, SMS, and integration with platforms like Microsoft Teams. This ensures timely responses to essential mistakes.
4. Does Azure Monitor offer tools to research the root purpose of JavaScript errors?
Yes, Azure Monitor offers various tools for in-intensity analysis. The Failures Blade gives certain records approximately failed requests and errors. You can also make use of Application Insights’ Profiler to research execution paths leading to JavaScript errors and identify performance bottlenecks.
5. Can I monitor JavaScript errors across different environments using Azure Monitor?
Absolutely. Azure Monitor may be configured for exceptional environments, along with development, staging, and production. This lets in you to seize errors early inside the development system and prevent them from affecting production customers.
Share your thoughts in the comments
Please Login to comment...