How to Redraw Other Graph in Same <canvas> ?
Last Updated :
26 Feb, 2024
In this article, we will learn how to redraw another graph in the same <canvas>. Redrawing Chart.js graphs in the same <canvas> tag involves destroying the existing graph and creating a new graph with updated or different datasets and options. We can use the destroy() method and a new Chart() instance to destroy the previous chart and redraw a new chart with new datasets.
Chart.js CDN link
<script src="https://cdn.jsdelivr.net/npm/chart.js"></script>
Syntax:
// Create the initial chart
const myChart = new Chart(ctx, {chartParams});

// Destroy the existing chart
myChart.destroy();

// Create a new chart with updated data and options
myChart = new Chart(ctx, {updateChartParams});
Example 1: The following code initially creates the bar graph with example dataset. On clicking the redraw button, it destroys an existing graph and creates a new bar graph with new dataset in the same canvas.
HTML
<!DOCTYPE html>
<html lang="en">
<head>
<meta charset="UTF-8">
<meta name="viewport"
content="width=device-width,
initial-scale=1.0">
<title>
Redraw graph example
</title>
<script src=
</script>
</head>
<body>
<div style="width: 70%;
height: 70%;">
<canvas id="myChart"></canvas>
</div>
<button onclick="redrawChart()">
Redraw Chart
</button>
<script>
// Get the canvas context
const ctx = document.
getElementById('myChart').
getContext('2d');
// Sample data
const data = {
labels:
['Label 1', 'Label 2', 'Label 3'],
datasets: [{
label: 'Initial Dataset',
data: [20, 15, 10],
backgroundColor:
['red', 'green', 'blue']
}]
};
const newData = {
labels:
['Label 1', 'Label 2', 'Label 3'],
datasets: [{
label: 'New Dataset',
data: [10, 20, 30],
backgroundColor:
['red', 'green', 'blue']
}]
};
// Create the initial chart
let myChart = new Chart(ctx, {
type: 'bar',
data: data,
});
// Function to redraw the chart
function redrawChart() {
// Destroy the existing chart
myChart.destroy();
// Create a new chart with
// updated data or options
myChart = new Chart(ctx, {
type: 'bar',
// Your updated data
data: newData,
});
}
</script>
</body>
</html>
|
Output:
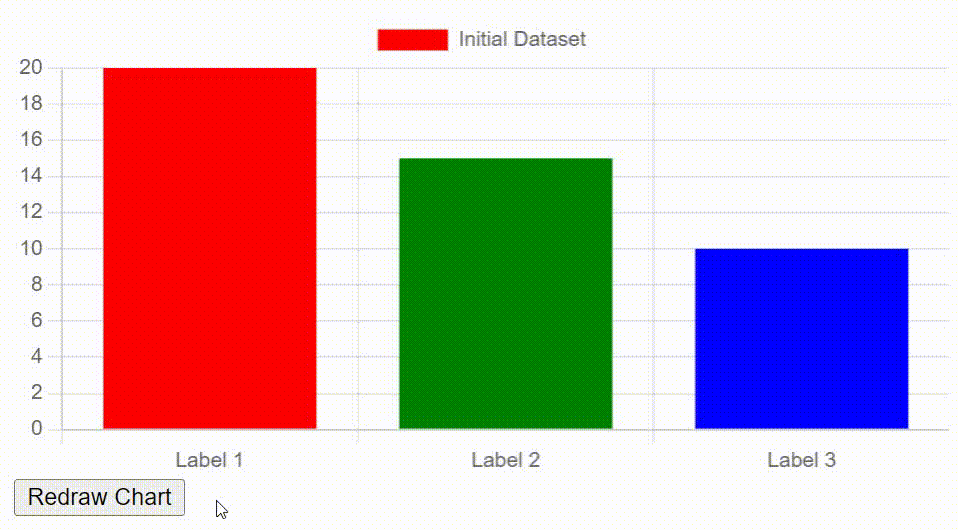
Redraw other graph in same canvas
Example 2: The following code initially creates the bar graph with given dataset. It destroys an existing graph and creates a new chart with same dataset but different type of chart.
HTML
<!DOCTYPE html>
<html lang="en">
<head>
<meta charset="UTF-8">
<meta name="viewport"
content="width=device-width,
initial-scale=1.0">
<title>
Chart.js Redraw Example
</title>
<script src=
</script>
</head>
<body>
<div style="width: 70%;
height: 70%;">
<canvas id="myChart"></canvas>
</div>
<button onclick="redrawBarChart()">
Bar Chart
</button>
<button onclick="redrawLineChart()">
Line Chart
</button>
<script>
// Get the canvas context
const ctx = document.
getElementById('myChart').
getContext('2d');
// Sample data
const data = {
labels: ['1', '2', '3'],
datasets: [{
label: 'Sample dataset',
data: [20, 15, 30],
backgroundColor:
['red', 'green', 'blue']
}]
};
// Create the initial bar chart
let myChart = new Chart(ctx, {
type: 'bar',
data: data,
});
// Function to draw bar chart
function redrawBarChart() {
// Destroy the existing chart
myChart.destroy();
// Create a new chart with
// updated data or options
myChart = new Chart(ctx, {
type: 'bar',
data: data,
});
}
// Function to draw line chart
function redrawLineChart() {
// Destroy the existing chart
myChart.destroy();
// Create a new chart with
// updated data or options
myChart = new Chart(ctx, {
type: 'line',
data: data,
});
}
</script>
</body>
</html>
|
Output:
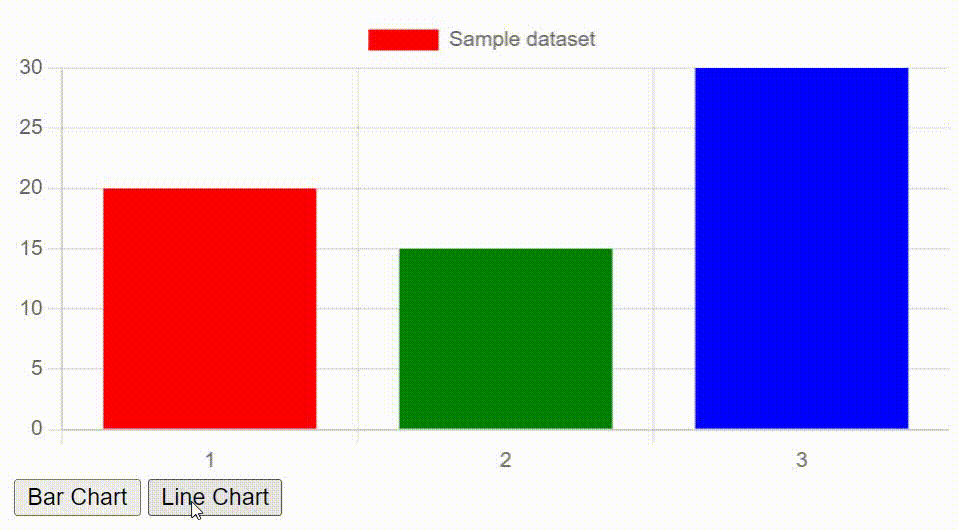
Redraw graphs in same canvas
Share your thoughts in the comments
Please Login to comment...