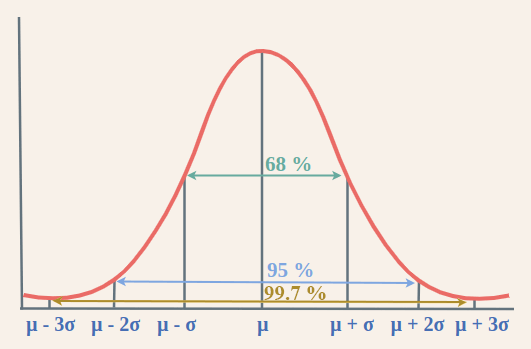
Empirical Rule, also known as the 68-95-99.7 rule, states that in a normal distribution, approximately 68% of the data falls within one standard deviation of the mean, 95% within two standard deviations, and 99.7% within three standard deviations.
In this article we will understand, Empirical Rule, Normal Distribution, Standard Deviation, Applications of Empirical Rule, Empirical Rule Formula, and others in detail.
What is Empirical Rule?
Empirical Rule, also known as the 68-95-99.7 Rule, is a statistical guideline that describes the distribution of data in a normal distribution. It states that in a bell-shaped curve, approximately 68% of the data falls within one standard deviation from the mean, about 95% within two standard deviations, and nearly 99.7% within three standard deviations. This rule provides a quick way to understand the spread of data and is applicable in various fields for analyzing and interpreting distributions.
Normal Distribution
A normal distribution, also known as a Gaussian distribution or bell curve, is a statistical concept that represents the probability distribution of a continuous random variable. In a normal distribution:
- Data is symmetrically distributed around the mean, with the highest frequency of observations at the mean.
- Curve is bell-shaped, with tails extending infinitely in both directions.
- Mean, Median and Mode are all equal and located at the center of the distribution.
- Standard deviation determines the spread or dispersion of data. About 68% of the data falls within one standard deviation of the mean, 95% within two standard deviations, and 99.7% within three standard deviations.
How Does Empirical Rule Work?
Empirical Rule serves as a valuable tool for estimating and understanding the variations within a dataset. By leveraging the concept of standard deviations, it provides a framework for assessing the expected variability in outcomes. In data analysis, where information is akin to gold, the empirical rule becomes particularly useful.
Consider a dataset exhibiting a normal distribution, which is graphically represented by a bell-shaped curve. In such cases, the empirical rule can be applied. It operates by utilizing three levels of standard deviation to gauge the anticipated variations in the estimated outcomes.
This process involves taking a set of observations and applying empirical rule to create approximations for population. This method aids in comprehending the distribution of data, identifying patterns, and making informed decisions based on the expected ranges of values. As data plays a crucial role in various fields, the empirical rule offers a practical and efficient means of analyzing and interpreting datasets with a normal distribution.
Empirical Rule Formula is as follows:
One Standard Deviation (µ ± σ): 68% of Data
Two Standard Deviation (µ ± 2σ): 95% of Data
Three Standard Deviation (µ ± 3σ): 99.7% of Data
- About 68% of data falls within one standard deviation of mean.
- Approximately 95% of data falls within two standard deviations of mean.
- Nearly 99.7% of data falls within three standard deviations of mean.
This rule applies to data that follows a normal distribution, represented by a bell-shaped curve. It provides a guideline for understanding the distribution of data points around the mean. The Empirical Rule is useful for analyzing and interpreting data, helping to identify trends, outliers, and patterns in datasets.
For Example: Suppose we have a dataset representing heights of students in a class, and data follows a normal distribution with a mean height of 65 inches and a standard deviation of 3 inches.
About 68% of students’ heights fall within one standard deviation of the mean. Using Empirical Rule, we can calculate that the range of heights within one standard deviation of mean is from 62 inches to 68 inches (65 ± 3). So, approximately 68% of the students have heights between 62 inches and 68 inches.
Approximately 95% of students’ heights fall within two standard deviations of the mean. With a standard deviation of 3 inches, the range within two standard deviations of the mean is from 59 inches to 71 inches (65 ± 2 × 3). Therefore, nearly 95% of the students have heights between 59 inches and 71 inches.
Nearly 99.7% of students’ heights fall within three standard deviations of the mean. The range within three standard deviations of the mean is from 56 inches to 74 inches (65 ± 3 × 3). Hence, almost all students, about 99.7%, have heights between 56 inches and 74 inches.
Chebyshev’s Theorem
Chebyshev’s Theorem is a more general rule that applies to any distribution, regardless of whether it is normal or not. It provides a lower bound on proportion of data values that fall within a certain number of standard deviations from mean. It states that,
Unlike Empirical Rule, Chebyshev’s Theorem does not provide specific percentages like 68%, 95%, or 99.7%. Instead, it offers a minimum guarantee about proportion of data values within a given range of standard deviations from mean, making it applicable to a wider range of distributions, including those that may not be perfectly normal.
- At least 1 – (1/k2) of data falls within k standard deviations of mean, where k is any number greater than 1.
Unlike Empirical Rule, Chebyshev’s Theorem does not provide specific percentages like 68%, 95%, or 99.7%. Instead, it offers a minimum guarantee about the proportion of data values within a given range of standard deviations from the mean, making it applicable to a wider range of distributions, including those that may not be perfectly normal.
Empirical Rule Vs Chebyshev’s Theorem
Empirical Rule and Chebyshev’s Theorem are both statistical concepts used to describe distribution of data, particularly in relation to mean and standard deviation. However, they differ in their specific applications and level of precision they provide in describing spread of data.
This table shows the key differences between the two statistical principles, focusing on their applicability, coverage, precision, assumptions, and interpretation.
| Aspect |
Empirical Rule
|
Chebyshev’s Theorem
|
|
Distribution Type
|
Specifically applicable to normal distributions.
|
Applicable to any distribution.
|
|
Range of Coverage
|
Provides specific percentages within 1, 2, and 3 Standard Deviations.
|
Provides a minimum percentage within k Standard Deviations (k > 1).
|
|
Precision
|
Provides precise percentages based on normality assumption.
|
Provides more conservative bounds regardless of distribution.
|
|
Assumptions
|
Assumes data follows a normal distribution.
|
Works for any distribution.
|
|
Interpretation
|
Offers more accurate estimates for normal distributions.
|
Offers broader, and less precise.
|
Empirical Rule
Also known as 68-95-99.7 Rule, Empirical Rule provides a guideline for percentage of data values that fall within a certain number of standard deviations from the mean in a normal distribution. It states that:
Empirical Rule is specifically applicable to normal distributions and provides a more precise description of the distribution within a narrower range of standard deviations from the mean.
- Approximately 68% of data falls within one standard deviation of mean.
- Approximately 95% of data falls within two standard deviations of mean.
- Approximately 99.7% of data falls within three standard deviations of mean.
Applications of Empirical Rule
Empirical Rule, also known as the 68-95-99.7 Rule, is widely applied in statistical analysis and data interpretation. Its key applications include:
- Data Assessment: This rule provides a quick and effective way to assess the distribution of data. By understanding the percentage of values within one, two, or three standard deviations from the mean, analysts can gauge the spread of a dataset.
- Quality Control: In manufacturing and quality control processes, the Empirical Rule helps identify whether a particular set of measurements is within the expected range. This is crucial for maintaining product consistency and meeting quality standards.
- Risk Management: Financial analysts and risk managers use the Empirical Rule to assess the variability of investment returns. Understanding the likelihood of returns falling within certain ranges aids in risk assessment and decision-making.
- Educational Assessment: In education, the rule is employed to analyze students’ performance on standardized tests. It helps educators identify the proportion of students scoring within specific performance bands.
- Process Control: Industries use the rule to monitor and control various processes. By analyzing data distribution, organizations can identify potential issues and implement corrective measures to maintain efficient operations.
- Forecasting: The rule is applied in forecasting to estimate the probability of different outcomes. This is valuable in fields such as meteorology, where predicting weather patterns involves understanding the likelihood of various conditions occurring.
- Healthcare Analysis: In medical research and healthcare analytics, the Empirical Rule aids in understanding the distribution of biological measurements. This is crucial for identifying normal ranges and detecting potential anomalies.
- Market Research: Researchers use the rule to analyze survey data and consumer behavior. It assists in identifying trends and patterns within the collected data, providing valuable insights for marketing strategies.
- Performance Evaluation: The rule is utilized in performance evaluations across various fields, including sports. It helps assess how individuals or teams perform relative to the average, providing a standardized measure.
- Resource Planning: Organizations use the rule in resource planning by assessing the variability of demand for products or services. This aids in inventory management and optimizing resource allocation.
Read More,
Examples on Empirical Rule
Example 1: Average height of students in a class is 65 inches with a standard deviation of 3 inches. Using Empirical Rule, estimate the percentage of students whose height falls between 59 inches and 71 inches.
Solution:
- Mean height (μ) = 65 inches
- standard deviation (σ) = 3 inches
According to Empirical Rule, approximately 68% of data falls within one standard deviation of mean.
So, to find percentage of students whose height falls between 59 inches and 71 inches, we look at area under the normal curve within one standard deviation of mean.
Since, this covers 68% of data, we can estimate that 68% of students’ heights fall between 59 inches and 71 inches.
Example 2: A factory produces widgets with a mean weight of 50 grams and a standard deviation of 4 grams. According to the Empirical Rule, what percentage of widgets will weigh between 42 grams and 58 grams?
Solution:
- Mean Weight = 50 grams
- Standard Deviation = 4 grams
Approximately 68% of data falls within one standard deviation of mean according to Empirical Rule.
So, we estimate that 68% of widgets will weigh between 42 grams and 58 grams
Example 3: Scores on a standardized test follow a normal distribution with a mean of 75 and a standard deviation of 10. Using the Empirical Rule, determine the percentage of students who scored between 55 and 95 on the test.
Solution:
- Mean Score = 75
- Standard Deviation = 10
Within one standard deviation of mean, approximately 68% of all scores fall.
So, we can estimate that 68% of students scored between 55 and 95 on test.
Practice Questions on Empirical Rule
Various practice questions on Empirical Rule are,
Q1: Average height of students in a class is 65 inches with a standard deviation of 3 inches. What percentage of students have a height between 62 inches and 68 inches?
Q2: Mean score on a standardized test is 500 with a standard deviation of 50. Approximately what percentage of students scored between 400 and 600 on the test?
Q3: A company’s monthly profit has a mean of $10,000 with a standard deviation of $2,000. What percentage of months does the company expect to have profits between $6,000 and $14,000?
Q4: Average daily temperature in a city during winter is 40°F with a standard deviation of 5°F. About what percentage of days can the residents expect the temperature to be between 30°F and 50°F?
Q5: Weight of apples in a crate follows a normal distribution with a mean of 150 grams and a standard deviation of 20 grams. What percentage of apples weigh between 110 grams and 190 grams?
Empirical Rule FAQs
Define of Empirical Rule
Empirical Rule, also known as the 68-95-99.7 Rule, states that for a normal distribution,
- Approximately 68% of the data falls within one standard deviation (SD) of the mean
- Approximately 95% of the data falls within two standard deviations (SDs) of the mean
- Approximately 99.7% of the data falls within three standard deviations (SDs) of the mean
How to Find percentage using empirical rule?
To find percentage of data within a certain range using Empirical Rule
- Determine mean and standard deviation of dataset.
- Apply percentages provided by the Empirical Rule: 68% for one SD, 95% for two SDs, and 99.7% for three SDs.
- Calculate range of values around mean based on number of standard deviations.
- Use this range to estimate percentage of data falling within it.
What is Empirical Rule Known As?
Empirical rule, also known as three-sigma rule or 68-95-99.7 rule.
Why Use Empirical Rule?
Empirical rule is use to determine outcomes when not all the data is available. It allows statisticians to gain insight into where the data will fall, once all is available.
Share your thoughts in the comments
Please Login to comment...