Contour plots
Last Updated :
22 Jan, 2021
A contour plot is a graphical method to visualize the 3-D surface by plotting constant Z slices called contours in a 2-D format. The contour plot is an alternative to a 3-D surface plot
The contour plot is formed by:
- Vertical axis: Independent variable 2
- Horizontal axis: Independent variable 1
- Lines: iso-response values, can be calculated with the help (x,y).
The independent variable usually restricted to a regular grid. The actual techniques for determining the correct iso-response values are rather complex and almost always computer-generated.
The contour plot is used to depict the change in Z values as compared to X and Y values. If the data (or function) do not form a regular grid, you typically need to perform a 2-D interpolation to form a regular grid.
For one variable data, a run sequence/ histogram is considered necessary. For two-variable data, a scatter plot is considered necessary. The contour plots can also polar co-ordinates (r,theta) instead of traditional rectangular (x, y, z) coordinates.
Types of Contour Plot:
- Rectangular Contour plot: A projection of 2D-plot in 2D-rectangular canvas. It is the most common form of the contour plot.
- Polar contour plot: Polar contour plot is plotted by using the polar coordinates r and theta. The response variable here is the collection of values generated while passing r and theta into the given function, where r is the distance from origin and theta is the angle from the positive x axis.
- Ternary contour plot: Ternary contour plot is used to represent the relationship between 3 explanatory variables and the response variable in the form of a filled triangle.
Contour plot can be plotted in different programming languages:
- Python/ Matplotlib: Contour plot can be plotted using plt.contour or plt.contourf functions, where plt is matplotlib.pyplot. The difference between these two that plot.contour generates hollow contour plot, the plt.contourf generated filled.
- Matlab: functions such as contourf (2d-plot) and contour3 (3D-contour) can be used for contour plotting
- R: can create a contour plot with filled.contour functions in R.
Implementations:
- Rectangular Contour Plot: Below is the sample code for plotting rectangular contour plots in Python and matplotlib.
Python3
import numpy as np
import matplotlib.pyplot as plt
def func(x, y):
return np.sin(x) ** 2 + np.cos(y) **2
x = np.linspace(0, 5, 50)
y = np.linspace(0, 5, 50)
X, Y = np.meshgrid(x, y)
Z = func(X, Y)
plt.contour(X, Y, Z, cmap='gist_rainbow_r');
|

- Polar Contour plot: For plotting polar contour plot we need to define first r and theta. Below is the sample code for plotting polar contour plots using matplotlib subplots.
Python3
rad_arr = np.radians(np.linspace(0, 360, 20))
r_arr = np.arange(0, 1, .1)
def func(r, theta):
return r * np.sin(theta)
r, theta = np.meshgrid(r_arr, rad_arr)
values = func(r,theta)
fig, ax = plt.subplots(subplot_kw=dict(projection='polar'))
ax.contourf(theta, r, values, cmap='Spectral_r')
plt.show()
|
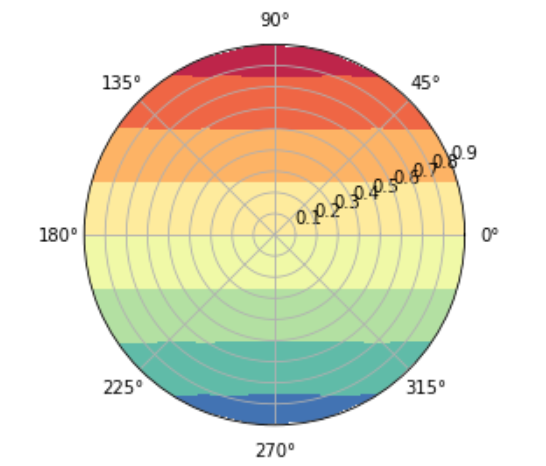
Polar contour plot
- Ternary Contour Plot: Matplotlib does not provide a definitive API for plotting Ternary Contour plot, however, there are many other package which does that. IN this example, we will be using Plotly library.
Python3
! pip install plotly
import plotly.figure_factory as ff
a = np.array([0. , 0. , 0., 0., 1./3, 1./3, 1./3, 2./3, 2./3, 1.])
b = np.array([0., 1./3, 2./3, 1., 0., 1./3, 2./3, 0., 1./3, 0.])
c = 1 - a - b
func = (a - 0.02) * b * (a - 0.5) * (b - 0.4) * (c - 1)**2
fig = ff.create_ternary_contour(np.array([a, b, c]), func,
pole_labels=['a', 'b', 'c'],
interp_mode='cartesian',
colorscale='Viridis',)
fig.show()
|

Ternary Contour plot
References:
Share your thoughts in the comments
Please Login to comment...