Bivariate Analysis
Last Updated :
20 May, 2024
Bivariate analysis examines the relationship between two variables. It is often denoted as X and Y. It helps uncover correlations and associations between different factors in data analysis.
Bivariate Analysis
In this article, we will understand the meaning of bivariate analysis and its definition, as well as the types of bivariate analysis and applications of bivariate analysis.
Bivariate Analysis
Bivariate analysis is a statistical method used to investigate the relationship between two variables. It is often used in quality-of-life research. It’s a straightforward form of quantitative analysis which examines two variables denoted as X and Y. For instance, consider a study examining the relationship between exercise duration (X) and heart rate (Y) during physical activity. By analyzing this bivariate data, researchers can determine if there’s a correlation between the duration of exercise and heart rate.
In bivariate analysis, researchers aim to understand to what extent one variable (possibly independent, like exercise duration) predicts the value of another (possibly dependent, like heart rate). It’s a basic yet valuable tool for testing hypotheses of association. Bivariate analysis contrasts with univariate analysis, which examines only one variable at a time. Results from bivariate analysis are typically organized in a two-column data table, making it easy to visualize the relationship between the variables.
In a study analyzing the relationship between study hours (X) and exam scores (Y), bivariate data can be collected from a sample of students. Each student’s study hours and corresponding exam score form a pair of variables denoted as (Xi, Yi), where i represents the individual student. The data can be represented in a table format as follows:
|
Observations
|
Study Hours
|
Exam Scores
|
|
1
|
10
|
85
|
|
2
|
5
|
70
|
|
3
|
6
|
75
|
|
4
|
8
|
80
|
|
5
|
4
|
65
|
This bivariate data allows researchers to analyze the relationship between study hours and exam scores to understand if there’s a correlation between the two variables.
Definition of Bivariate Analysis
Bivariate analysis is when we look at two things together to see how they’re related. For example, if we want to know if how much someone studies (one thing) affects their test scores (other thing), we would use bivariate analysis.
Types of Bivariate Analysis
The various types of bivariate analysis are:
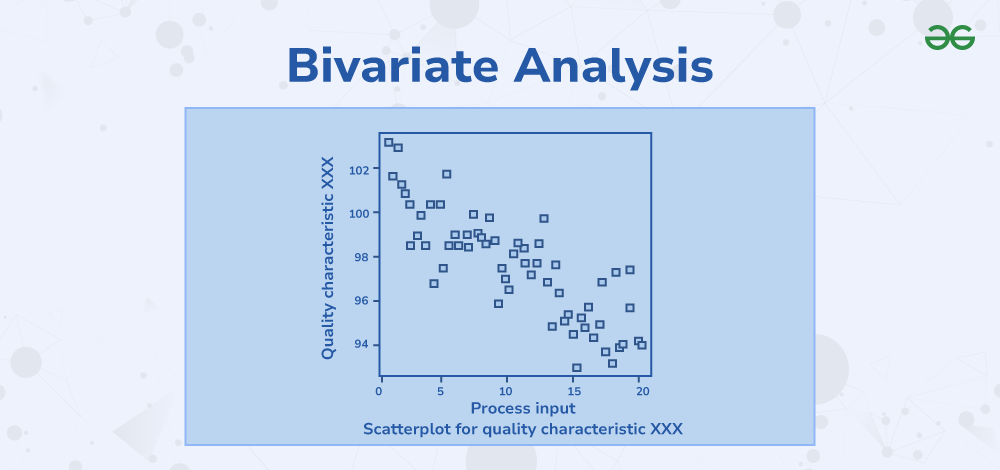
Scatter Plots
Scatter plots visually display the relationship between two variables. Each dot on the plot represents a single observation, with one variable plotted on the x-axis and the other on the y-axis. The pattern formed by the dots can reveal the nature of the relationship between the variables—whether it’s positive, negative, or no correlation.
.webp)
Scatter Plots
Correlation Analysis
Correlation analysis quantifies the strength and direction of the relationship between two continuous variables. The correlation coefficient, typically denoted by “r,” ranges from -1 to 1. A positive value indicates a positive correlation (as one variable increases, the other tends to increase), while a negative value suggests a negative correlation (as one variable increases, the other tends to decrease). A value close to zero indicates little to no correlation.
Regression Analysis
Regression analysis explores the relationship between two or more variables, typically by predicting one variable (the dependent variable) based on the values of one or more other variables (the independent variables). Simple linear regression involves predicting a dependent variable from a single independent variable, while multiple linear regression involves predicting the dependent variable from multiple independent variables.
Chi-Square Test
The chi-square test examines the association between two categorical variables by comparing the observed frequencies in a contingency table to the frequencies that would be expected if the variables were independent. It determines whether the observed association between the variables is statistically significant or due to random chance.
T-tests and ANOVA
T-tests and analysis of variance (ANOVA) are used to compare means between groups for one or more independent variables. In bivariate analysis, they can be applied to examine whether there are significant differences in the mean values of a continuous variable across different categories of another variable. T-tests are suitable for comparing means between two groups, while ANOVA is used for comparing means among three or more groups.
Advantages and Disadvantages of Bivariate Analysis
Bivariate analysis offers several advantages and disadvantages, depending on the context and the specific goals of the analysis.
Advantages:
- Simplicity: Bivariate analysis is straightforward and easy to understand, making it accessible to a wide range of users, including those with limited statistical expertise.
- Identification of Relationships: Bivariate analysis helps identify relationships between two variables, allowing researchers to explore associations, correlations, or dependencies between them.
- Visualization: Techniques like scatterplots and contingency tables provide visual representations of the relationship between variables, making it easier to interpret the data and identify patterns.
- Foundation for Further Analysis: Bivariate analysis serves as a foundation for more advanced multivariate analyses. Understanding the relationship between two variables can inform subsequent analyses involving multiple variables.
- Hypothesis Testing: Bivariate analysis allows researchers to test hypotheses about the relationship between variables, such as whether there is a significant correlation or association.
- Practicality: In many situations, particularly in exploratory data analysis or initial stages of research, focusing on the relationship between two variables is practical and sufficient for drawing meaningful insights.
Disadvantages:
- Limited Scope: Bivariate analysis examines the relationship between only two variables, which may oversimplify complex phenomena influenced by multiple factors. It may not capture the full complexity of real-world relationships.
- Confounding Variables: Bivariate analysis does not account for the influence of confounding variables—factors that may affect both variables being studied—potentially leading to biased or misleading conclusions.
- Causality: While bivariate analysis can identify associations between variables, it cannot establish causality. Correlation does not imply causation, and additional research is needed to determine causal relationships.
- Missed Patterns: Focusing solely on the relationship between two variables may overlook important patterns or trends that emerge when considering additional variables (multivariate analysis).
- Assumptions: Some bivariate analysis techniques, such as correlation and regression, rely on specific assumptions (e.g., linearity, normality) that may not hold true in all cases. Violating these assumptions can lead to inaccurate results.
- Data Limitations: Bivariate analysis may be limited by the availability or quality of data. If the dataset is small, incomplete, or biased, the results of the analysis may not be representative or reliable.
- Interpretation Challenges: While bivariate analysis provides insights into the relationship between variables, interpreting the results requires careful consideration of context, potential biases, and alternative explanations.
Applications of Bivariate Analysis
Bivariate analysis finds applications in various fields, including:
- It helps researchers understand relationships between variables like income and education level, crime rates and unemployment, or happiness and marital status.
- Bivariate analysis is used to study the relationship between factors like supply and demand, interest rates and inflation, or GDP and unemployment.
- It helps in analyzing the correlation between factors such as diet and health outcomes, exercise and disease risk, or medication adherence and treatment effectiveness.
- Bivariate analysis assists marketers in understanding relationships between variables like advertising expenditure and sales revenue, customer demographics and purchasing behavior, or product features and consumer satisfaction.
- It helps in studying correlations between factors such as pollution levels and respiratory illnesses, climate variables and agricultural productivity, or habitat loss and species diversity.
- Bivariate analysis is used to explore relationships between factors like study habits and academic performance, class size and student engagement, or teacher qualifications and student achievement.
- It helps in analyzing relationships between variables like stock prices and company earnings, interest rates and bond yields, or asset allocation and investment returns.
- Bivariate analysis helps psychologists understand correlations between factors such as stress levels and mental health, personality traits and behavior patterns, or therapy outcomes and treatment adherence.
Difference between Univariate, Bivariate and Multivariate Analysis
The basic difference between univariate, bivariate, and multivariate analysis is explained in the table added below:
|
Univariate Analysis
|
Bivariate Analysis
|
Multivariate Analysis
|
|
Univariate analysis involves the analysis of a single variable. This helps to describe and summarize the characteristics and distribution of that variable.
|
Bivariate analysis involves the analysis of the relationship between two variables. This helps to examines how one variable behaves in relation to another.
|
Multivariate analysis involves the simultaneous analysis of three or more variables. This helps to examines the complex relationships between multiple variables.
|
|
Techniques used in univariate analysis include:
- Measures of Central Tendency (Mean, Median, Mode)
- Measures of Dispersion (Range, Variance, Standard Deviation)
- Frequency Distributions, etc.
|
Techniques used in bivariate analysis include
- Correlation Analysis
- Scatter Plots
- Cross-Tabulations (Contingency Tables)
- Bivariate Regression Analysis, etc.
|
Common techniques used in multivariate analysis include:
- Multiple Regression Analysis
- Factor Analysis
- Principal Component Analysis (PCA)
- Cluster Analysis, etc.
|
|
Univariate analysis is useful for understanding the basic properties of a variable and identifying any outliers or patterns within it.
|
Bivariate analysis helps in understanding the strength and direction of the relationship between two variables. It is particularly useful for identifying associations or dependencies between variables.
|
Multivariate analysis allows for the exploration of interactions and dependencies among multiple variables. It helps in understanding the combined effect of several variables on an outcome or in identifying latent structures within the data.
|
Examples of Bivariate Analysis
Example 1: A teacher collect data on total hours studied by students and total marks scored by them is shown in the table below:
|
Total Hours Studied in a Week
|
Marks scored out of 700
|
|
14
|
450
|
|
12
|
413
|
|
20
|
490
|
|
22
|
566
|
|
24
|
576
|
|
29
|
640
|
|
13
|
340
|
Solution:
The teacher might decide to determine the correlation between the two variables, which she or he may find to be 0.926.
This shows that the two variables have a very strong positive association.
In other words, the marks scored by a student in a test is directly correlated to number of hours stuied by him/her.
Bivariate Analysis – FAQs
What is meant by bivariate analysis?
Bivariate analysis refers to the statistical analysis of two variables to understand the relationship between them. It involves examining how changes in one variable relate to changes in another variable.
What are three types of bivariate analysis?
The three types of bivariate analysis are:
- Scatter Plots
- Correlation Analysis
- Regression Analysis
What is the use of bivariate analysis?
The primary use of bivariate analysis is to explore and understand the relationship between two variables. It helps researchers identify patterns, trends, and correlations in data, which can inform decision-making and further research.
What are the different types of bivariate analysis?
Different types of bivariate analysis include scatter plots, correlation analysis, regression analysis, chi-square tests, and t-tests/ANOVA.
What are advantages of bivariate analysis?
Advantages of bivariate analysis include:
- It provides insights into the relationship between two variables.
- It helps identify potential cause-and-effect relationships.
- It enables prediction and modeling based on the relationship between variables.
- It facilitates hypothesis testing and decision-making in various fields such as social sciences, economics, healthcare, and more.
Share your thoughts in the comments
Please Login to comment...