What is KPI?
KPI is used to measure a company’s performance in the long run. With the help of KPIs, the company can track its performance over time and make crucial changes to make sure that they are moving in the right direction. It is important because it helps in setting priorities and allocating the resources to help the companies identify their strength and weaknesses, opportunities and dangers.
KPI stands for “Key Performance Indicator”. KPIs are used by organisations, divisions, management and teams to evaluate the efficiency of business activities. To accomplish the goals and objectives of the organisation, one can also employ key performance indicators.
Types of KPIs
1. Quantitative Indicators: The only metric used to measure quantitative indicators is a number. Quantitative indicators come in two varieties: continuous and discrete. For call centers and help desks, it may include metrics like Miles Travelled or Time Spent Per Call and they can take any value throughout a range. Complaints, accidents, and customer acquisition numbers are examples of discrete quantitative metrics that are whole numbers.
2. Qualitative Indicators: Numbers are not used to measure qualitative indicators. A qualitative KPI typically refers to a property of a procedure or business choice. More attention is typically given to experiences, sentiments and the intangible worth that we place on them in qualitative indicators.
3. Leading Indicators: Leading indicators are employed to predict the outcomes of process modifications and confirm long-term data trends. It basically looks at what might happen, such as when a new product or service is offered.
4. Input Indicator: Input indicators are used to estimate the amount of resources required for a project or business activity. Staff availability, cash in hand and the amount of necessary equipment are a few examples of input indicators.
5. Process Indicators: Process indicators are used particularly for evaluating the extent to which a process is working as well as to help with any necessary improvements. Process indicators that illuminate the customer support process include tickets closed, tickets opened, and typical resolution times.
6. Output Indicators: Output indicators evaluate a process’s or a business activity’s success or failure. Revenues, sales or the number of new customers gathered are a few examples of output KPIs.
7. Directional Indicators: Directional indicators assess particular solid patterns, such as the direction of the measurements, maintaining, deteriorating or improving.
8. Financial Indicators: Financial stability, growth and corporate survival are measured by financial indicators. These give clear information about a company’s financial situation.
9. Lagging Indicators: Lagging indicators evaluate a company’s present performance in a given industry with its previous achievements in the same industry.
10. Practical indicators: Practical indicators examine how a company’s current processes work, frequently including monitoring or feedback on those processes.
11. Actionable indicators: A company’s capacity to implement change, whether through legislative efforts or a change in corporate culture, is measured by actionable indicators.
12. Outcome Indicators: Outcome indicators show if the programme is accomplishing its objectives over a period of time.
Importance of KPIs
KPIs are important in various aspects. Some of them are stated below:
1. Measurement: As KPIs are precise and quantitative, organizations may monitor their performance over time. It can be stated in terms of ratios, numbers, percentages, or other pertinent units.
2. Relevance: KPIs are closely related to the aims and objectives of an organization and help ensure that resources and efforts are concentrated on the issues that matter most to the company.
3. Monitoring and Decision-Making: KPIs are used for continuous monitoring and can have an impact on decision-making procedures. A KPI can prompt actions to address a problem or take advantage of an opportunity when it shows a problem or significant shift.
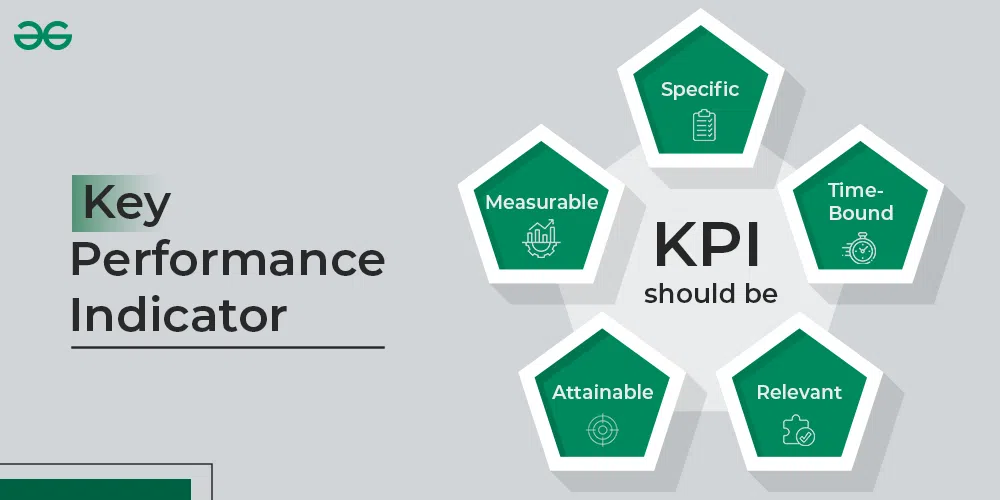
4. SMART Criteria: Effective KPIs are frequently established by the SMART criteria, which stands for Specific, Measurable, Achievable, Relevant, and Time-bound.
5. Early Problem Detection: KPIs serve as early warning systems in the early detection of problems. When a KPI declines or differs from the objective, it indicates that there might be an issue or a chance to remedy it.
6. Resource Allocation: KPIs assist organizations in making effective resource allocations. Organisations can strategically manage funds, staff and other resources by determining which areas are working effectively and which require improvement.
7. Alignment and Communication: KPIs help organizations internal communications. They give a discussion of performance at all levels, from top management to front-line staff, a standard language and metric.
8. Variety: KPIs can differ significantly depending on the organization’s goals, department, and industry. For instance, KPIs in sales could be revenue growth, conversion rates or cost of customer acquisition, while in manufacturing they might be product flaws, production effectiveness or on-time delivery.
It takes a systematic approach that is in line organisation’s goals and objectives to identify the best Key Performance Indicators (KPIs). The following procedures will help to properly discover and develop KPIs:
1. Establish Specific Goals: The strategic objectives and goals of your organisation should be stated first.
2. Determine the CSFs (Critical Success Factors): CSFs are elements or practices that are essential to reaching your goals.
3. Recognise your Audience: Think about the audience for these KPIs and the data that will be most useful to them.
4. Come up with KPI ideas: Collaborate with relevant stakeholders or a cross-functional team to come up with some suitable KPIs. Think of indicators that are both quantitative and qualitative and that match your CSFs.
5. Prioritize KPIs: Give the KPIs that are most important to your goals and those that can measure the highest priority.
6. Determine your Goals: For each KPI, specify precise target values or ranges.
7. Take Notes: Choose the method for data collection for each KPI and also make sure you have access to the tools and data sources that are required.
8. Apply Measurement Procedures: Create procedures and protocols for collecting, analyzing, and reporting KPI data regularly.
9. Examine and Improve: Review your KPIs frequently to make sure they are still applicable to your goals. As necessary, make alterations or replacements.
10. Communicate and Observe: Keep an eye on your KPIs and share the results with everyone in your organisation.
11. Take Action: Take action to fix problems or capture opportunities as soon as you discover trends or deviations in the data.
12. Employ Visualisation: Use data visualization approaches to make KPI data more comprehensible and accessible to stakeholders, such as charts, graphs and dashboards.
13. Obtain Feedback: Encourage employee and stakeholder feedback on the applicability and efficiency of your KPIs. Adapt them as necessary.
14. Document Your KPIs: Keep a detailed record of your KPIs, including their definitions, methods of measurement and objectives.
How to measure KPIs?
The general framework for measuring KPIs is as follows:
1. Metrics Definition and Data Sources: Clearly state what you are going to measure and how you will measure it in the metrics linked to the KPI. Determine the informational sources that will supply the required data.
2. Data Gathering: Gather information from the suggested sources. This might involve carrying out surveys, manually entering data, extracting data from databases and systems or using other data collection techniques.
3. Validation and Cleanup of the Data: Ensure the information gathered is precise and comprehensive. Eliminate any anomalies or errors that can affect the results.
4. Visualizing Data: Utilize graphs, charts and dashboards to visually present the KPI data.
5. Regular Reporting: Create routine reports that contain the KPI values, historical trends and any pertinent insights.
6. Examining and Interpreting: To determine what the KPI data implies for your organisation, analyse it. Determine the trends, patterns, and areas where performance is either meeting or not meeting expectations.
7. Continuous Monitoring: Keep an eye on the KPI over time to track development and assess the effectiveness of any changes done.
8. Communication and Reaction: Inform the appropriate organisation stakeholders of KPI findings and insights. To promote a data-driven culture, encourage debate and feedback.
Examples of KPIs
Examples of KPIs in different fields are:
1. Business: Growth in revenue, retention of customers, and profit margin.
2. Marketing: Metrics include website traffic, conversion rates and return on advertisement spend (ROAS).
3. Human Resources: Time taken to fill open positions, employee satisfaction index and staff turnover rate.
4. Manufacturing: Production cycle time, defect rate, and overall equipment effectiveness (OEE) in manufacturing.
5. Healthcare: Mortality rate, readmission rate and patient satisfaction score.
6. Project management: The metrics include project duration, cost overruns and task completion rates.
How to create & develop KPI?
The following points are to be followed for creating and developing the KPIs:
1. Define Objectives and Goals Clearly to the Team: Clearly define the organisation’s goals for everyone. Also, the goals should be specific, measurable, achievable, relevant and time-bound.
2. Identify Key Focus Areas and Select Relevant Metrics: The team should identify the main key point that is to be focused and then select the required measures for that.
3. Establish Baseline Data: The team should determine the start.
4. Set Target Values and Define Data Sources: Targets should be set based on the goals of the organisations. Data sources should be defined properly with the team so that every member knows his or her responsibility.
5. Establish Data Collection Processes: The datawho collection process should be determined first so that no problem occurs after the start.
6. Assign Ownership and Set the Frequency of Measurement: Make sure to make a team leader who is capable of handling the team.
7. Analyze and Interpret the Data: The organisation should determine how to collect the data that is necessary and how it is updated from time to time.
8. Communicate the Results with the Team: Everyone in the team should know about the end-results of the project and the results should be communicated with the teams clearly.
Share your thoughts in the comments
Please Login to comment...