How to Perform a KPSS Test in R
Last Updated :
26 Apr, 2024
In this article, we will discuss What is KPSS Test and how to perform the KPSS Test in R Programming Language.
What is the KPSS Test?
The KPSS (Kwiatkowski-Phillips-Schmidt-Shin) test is a statistical test used to determine whether a given time series is stationary around a deterministic trend. It is commonly employed in econometrics and time series analysis.
This test uses the null and alternative hypothesis
- Null Hypothesis (H0): The series is stationary, meaning that it does not have a unit root. A unit root implies a stochastic trend or non-stationarity.
- Alternate Hypothesis (H1): The series is non-stationary due to a unit root.
The test uses an auxiliary model to examine stationarity:
Model: The KPSS test involves decomposing the time series into three components: a deterministic trend, a stationary error, and a random walk (with or without drift). The random walk captures the non-stationarity in the series, while the stationary error represents white noise.
Mathematically, the model is written as:
Yt = α + β⋅t + μt + ϵt
Where:
- α represents a constant or intercept.
- 𝛽 is the coefficient for the deterministic trend (optional).
- 𝜇𝑡 is a random walk.
- 𝜖𝑡 is the stationary error term.
The key measure in the KPSS test is the sum of squared partial sums of residuals, normalized by a scaling factor that depends on the sample size. This measure captures the deviation from stationarity. The KPSS statistic is then compared to critical values to determine if the series is stationary or not.
- Critical Values: These are derived from simulations and depend on the significance level (e.g., 1%, 5%, 10%). If the KPSS statistic is greater than the critical value, we reject the null hypothesis, indicating non-stationarity.
Why KPSS Test is Required?
The KPSS (Kwiatkowski-Phillips-Schmidt-Shin) test is used to determine whether a given time series is trend stationary or not. Trend stationarity refers to the property where the mean and variance of the time series do not change over time, implying the absence of a systematic trend.
- Detect trend stationarity: The KPSS test checks if a time series has a constant mean and variance over time, indicating trend stationarity.
- Complement to other tests: It complements tests like the ADF test, providing a more complete picture of stationarity.
- Identify trend components: Useful for spotting systematic trends in data, guiding forecasting and modeling.
- Modeling aid: Helps decide if transformations like differencing are needed for accurate modeling.
- Policy and diagnostics: Insights for policymakers and as a diagnostic tool to validate assumptions.
How to Perform a KPSS Test in R?
To perform a KPSS (Kwiatkowski-Phillips-Schmidt-Shin) test in R, we can use the urca package. This package provides functions to conduct unit root tests, including the KPSS test.
R
install.packages("urca")
library(urca)
Prepare your time series data. Ensure that the data is stored in a vector or a time series object (e.g., ts or zoo).
Use the ur.kpss() function to perform the KPSS test. This function takes the time series data as input and returns a test object containing the results of the test.
R
# Example time series data
# Replace this with your own data
data <- c(10, 12, 15, 18, 20, 22, 25, 28, 30, 32)

# Perform KPSS test
kpss_test <- ur.kpss(data)
# summary of KPSS Test
summary(kpss_test)
Output:
#######################
# KPSS Unit Root Test #
#######################

Test is of type: mu with 2 lags.

Value of test-statistic is: 0.4547

Critical value for a significance level of:
                10pct  5pct 2.5pct  1pct
critical values 0.347 0.463  0.574 0.739
The summary provides the test statistics and p-values. The null hypothesis of the KPSS test is stationarity. Therefore, if the p-value is less than the chosen significance level (e.g., 0.05), we would reject the null hypothesis and conclude that the series is non-stationary.
To perform a KPSS test in R, we can also use the tseries package and ensure reproducibility by setting a seed. Then, prepare time series data. Utilize the kpss.test() function from the tseries package, specifying the null hypothesis (typically “Trend” or “Level”).
Perform a KPSS Test With Stationary Data
R
# Load necessary library
library(tseries)
library(ggplot2)

# Generate stationary data (Example)
set.seed(123)
stationary_data <- rnorm(100)  # Normally distributed data

# Create a data frame for plotting
stationary_df <- data.frame(Time = 1:100, Value = stationary_data)

# Perform KPSS Test
kpss_test_stationary <- kpss.test(stationary_data, null = "Trend")

# Output KPSS test result
kpss_test_stationary
Output:
        KPSS Test for Trend Stationarity

data:  stationary_data
KPSS Trend = 0.059139, Truncation lag parameter = 4, p-value = 0.1
Plot the stationary data
R
# Plot the stationary data
ggplot(stationary_df, aes(x = Time, y = Value)) +
  geom_line() +
  geom_smooth(method = "loess", se = FALSE, color = "blue") +
  labs(title = "Stationary Data", x = "Time", y = "Value") +
  theme_minimal()
Output:

Perform a KPSS Test in R
Generates stationary data by creating 100 random numbers from a normal distribution (rnorm(100)).
- Represents a dataset with constant mean and variance, with no observable trend.:
- Creates a data frame with two columns: Time (representing time points from 1 to 100) and Value (the generated stationary data).
- Uses ggplot2 to create a line plot with Time on the x-axis and Value on the y-axis.
- Adds a smooth line (geom_smooth) with loess method to highlight the overall pattern.
- Includes minimalistic labels and theme for clarity.
Perform a KPSS Test With Non-Stationary Data
R
# Load necessary libraries
library(tseries)  # For KPSS test
library(ggplot2)  # For plotting

# Generate non-stationary data with a trend
set.seed(123)
trend <- 0.05 * (1:100)  # Linear trend
non_stationary_data <- trend + rnorm(100)  # Add noise

# Create a data frame for plotting
non_stationary_df <- data.frame(Time = 1:100, Value = non_stationary_data)n

# Perform KPSS test for trend stationarity
kpss_test_non_stationary <- kpss.test(non_stationary_data, null = "Trend")

# Output the KPSS test result
kpss_test_non_stationary
Output:
          KPSS Test for Trend Stationarity

data:  non_stationary_data
KPSS Trend = 0.059139, Truncation lag parameter = 4, p-value = 0.1
Plot the non-stationary data
R
# Plot the non-stationary data
ggplot(non_stationary_df, aes(x = Time, y = Value)) +
  geom_line() +
  geom_smooth(method = "loess", se = FALSE, color = "red") +
  labs(title = "Non-Stationary Data", x = "Time", y = "Value") +
  theme_minimal()
Output:
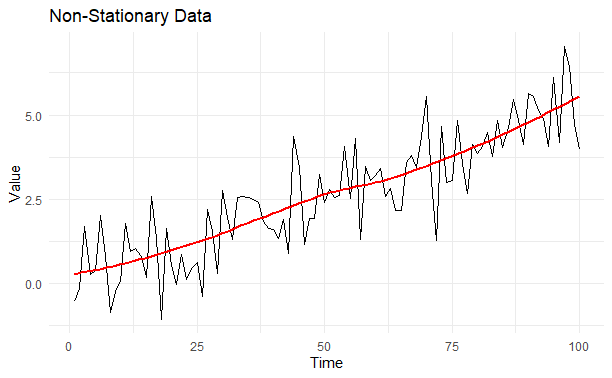
How to Perform a KPSS Test in R
Generates non-stationary data by adding a linear trend (0.05 * (1:100)) to 100 random numbers from a normal distribution.
- Represents a dataset with a noticeable trend or varying variance.
- Creates a data frame with two columns: Time (1 to 100) and Value (the generated non-stationary data).
- Creates a line plot with Time on the x-axis and Value on the y-axis using ggplot2.
- Adds a smooth line (geom_smooth) with loess method to illustrate the upward trend.
- Uses minimalistic labels and theme for clarity.
- The plot shows a clear upward trend, indicating non-stationarity, with consistent increase in the data over time.
Uses of KPSS Test:
The KPSS test has several applications across various fields :
- Time Series Analysis: Determines if data has consistent trends over time.
- Economics and Finance: Assesses stationarity of economic and financial indicators.
- Policy Analysis: Helps policymakers understand long-term trends for better decision-making.
- Environmental Science: Analyzes trends in climate and ecological data.
- Engineering and Signal Processing: Detects patterns in signals for monitoring and optimization.
- Healthcare and Biomedical Research: Identifies trends in patient outcomes and disease incidence.
- Quality Control and Manufacturing: Ensures consistency in production processes.
Conclusion
The KPSS test serves as a complementary tool to other stationarity tests like the Augmented Dickey-Fuller (ADF) test, providing insights into different aspects of stationarity in time series data.
Share your thoughts in the comments
Please Login to comment...