Applications of Venn Diagrams: Venn diagrams are popularly used in our daily life for visual representation, the Venn diagrams are used to describe how various sets overlap one another. Venn diagram uses circles for a particular group of elements and when these circles overlap each other then it means those elements have one or more common properties.
The Venn diagrams are named after the person who founded and popularized them in the late 1880s by John Venn who was an English logician. In this article, we will look at the different uses and applications of the Venn diagrams in real life.
What are Venn Diagrams?
Venn diagram is used to represent a group of same category elements and when there is more than one group of elements where the group or set of groups overlap each other then we can say that the overlapping groups have similar elements in them, this can be easily represented visually using the Venn Diagram.
Also Read: Venn Diagrams

Applications of Venn diagrams in real life.
Venn diagram is a popular method that is used for representing the elements in a group visually and it is also a very popular concept in the field of mathematics, there are many real-life applications of the Venn diagram as well.
Uses / Applications of Venn Diagrams
Venn diagram is used both in real life as well as for theoretical representation in various situations such as:
- Solving Complex Mathematic Problems
- Logical Representation
- Visual Organization of Information
- Marketing and Management
- Computer Science
Applications of Venn Diagrams in Real Life
1. Solving Complex Mathematic Problems
Venn diagram is very popular in solving complex mathematical problems especially when it comes to solving set operations such as unions, intersections, and complements. By using the Venn diagram we can easily draw the visual representation of these problems and have a clear view about the complex problem.
Venn diagrams are also used in the solution of probability problems because this diagram can easily be used to describe the probability of different solutions in a visual representation so whether we are using set problems or trying to solve complex probability questions, we can use the Venn diagram to get the solution faster and understand the problem more easily with visual representation.
Example: In a class of 50 students, 30 students like maths, 25 like science, and questionscomplex probability questionsreal-life, and 15 like both then what is the number of students who like neither of them?
Solution:
By representing the problem in venn diagram we get the following:
n(A U B) =n (A)+n(B)- n (A intersection B)
No. of students who don’t like Maths and Science is = x.
50 = 30 + 25 —15 + x
x = 50 — 40 = 10
By using Venn diagram we can say that there are 10 students who don’t like either of the subjects.
2. Logical Representation of Venn Diagrams
Logical representation is also a real-life example of the Venn diagram that we have, as the Venn diagram allows for a visual representation of the data which helps us to use complex data and then simply use the Venn diagram so that everyone can easily understand the solution through the help of Venn diagram.
Venn diagram is also used widely in the education sector to visually describe the difference between different topics such as the difference between schools and universities, we can use the Venn diagram to describe the difference between these two topics and use the overlapping space to describe the common different things which are available in the smartphone and desktop, you can see this in the image below:
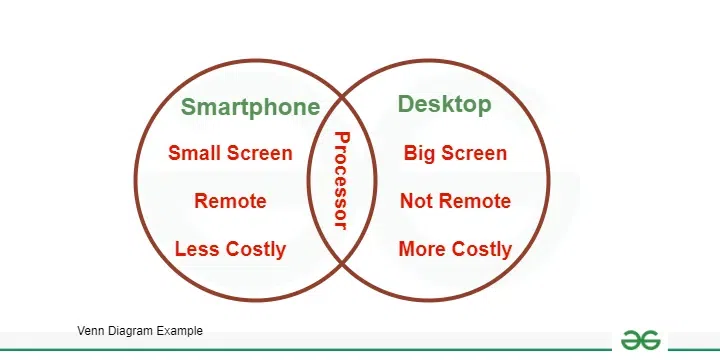
Logical Representation
Venn diagram is commonly used in real life to present the visualization of various types of information, this is why the Venn diagrams are commonly used by companies to represent the data about their customers and management in visual form.
Companies use the Venn diagram to represent all kinds of data such as customer demands and needs, corporate requirements and structures among other things, these data are complex and not every individual in the company can understand these types of data which is why they use the Venn diagram so that they can represent the data in more simple and visual formatting to help the members of the company in better understanding.
4. Marketing and Management
Another real-life use case of the Venn diagram is the logical representation of various data, for example, we can use the Venn diagram to logically represent different types of data such as companies can use the Venn diagram to represent market behavior and derive a conclusion about their customer’s needs and demands in pictorial forms.
Marketing and management are an important part of the growth of any company and the Venn diagram plays a very important role in the marketing and management for any company because it helps to visualize the data simply and help the audience to understand it by understanding the information and defining the relationship between these set of elements.
5. Computer Science
Venn diagram is used in computer science and many of its applications such as database management systems, data structures, algorithms, and boolean logic among other applications of computer science.
The software developers can use the Venn diagrams to visualize and implement the set operations such as union, difference, intersection, etc. because the Venn diagram can be used to represent these types of operations simply and also provide a better understanding of the concept that is being used.
Example: Venn diagram can be used in database management systems because the database administrators can use the Venn diagram and represent the relationship between different tables and schemas, by analyzing the common features and different features of the entities in a database they can improve the performance and efficiency of their databases.
People Also Read:
Practice Problems on Applications of Venn Diagrams
Problem 1: In a school, 150 students are in the Math Club, 120 are in the Science Club, and 90 are in the Chess Club. 60 students are in both the Math and Science Clubs, 30 are in both the Science and Chess Clubs, and 40 are in both the Math and Chess Clubs. 20 students are in all three clubs. Use a Venn diagram to find out how many students are in at least one of the clubs.
Problem 2: A survey of 200 households finds that 80 have dogs, 60 have cats, and 40 have birds. 30 households have both dogs and cats, 20 have both cats and birds, and 10 have both dogs and birds. 5 households have all three types of pets. Use a Venn diagram to determine how many households do not have any of the three types of pets.
Problem 3: In a group of 100 people, 70 like pizza, 50 like burgers, and 60 like tacos. 40 people like both pizza and burgers, 30 like both burgers and tacos, and 35 like both pizza and tacos. 25 people like all three. Create a Venn diagram to figure out how many people do not like any of the three foods.
Summary – Applications of Venn Diagrams
Venn diagrams are a simple yet powerful tool used widely in various fields to visually organize information, solve complex problems, and represent relationships between different sets. Originating from the work of John Venn in the late 1880s, these diagrams use overlapping circles to show how groups share common properties. In education, they help distinguish between concepts like schools and universities by highlighting similarities and differences.
Businesses use them to understand customer needs and market behaviors, making complex data more accessible. In computer science, Venn diagrams are crucial for visualizing data relationships, aiding in database management, and understanding algorithms. They are particularly effective in solving mathematical problems involving set operations such as unions and intersections, and in logical and probability calculations. Overall, Venn diagrams serve as a visual bridge between complex ideas, simplifying information analysis and problem-solving across disciplines.
FAQs on Applications of Venn Diagrams
Why are Venn diagrams important, what do they mean?
Venn diagrams are important because can help us to in order to visualize the complex problems and solve them by using visual diagram about the problem, the venn diagram contains one or more circles which are used to represent different set of items, the overlapping between these circles represents the common thing among these set of items.
What is role of Venn diagrams in Computer Science?
Venn diagrams are used in order to visualize the different types of data sets and the relationship among these data sets, they are also used in circuit designing and various other software engineering tasks.
What are main components of a Venn diagram?
The main component of the venn diagram are the circles which are used to represent sets, when there are one or more circles overlapping then it means that they are having common properties. apart from the circles we can also use annotation may be used as well.
How do Venn diagrams help in problem-solving?
Venn diagrams help in the problem solving because it provides a visual representation of the data by combining them inside a set and then try to identify the common properties and visualize the overlap that these sets have which helps in deriving solutions more efficiently.
What are common misconceptions about Venn diagrams?
There is a common misconception about the venn diagrams that they can only be used to represent two or three sets when in reality we can represent any number of sets using the venn diagram but we should keep in mind that it can become more and more difficult to calculate the corresponding overlap as the sets increase.
What are the main applications of Venn Diagrams?
- Education and Logic
- Statistics and Probability
- Data Science and Analysis
- Computer Science
- Problem Solving
- Business and Management
- Marketing
- Project Management
- Healthcare and Medicine
- Environmental Science
Share your thoughts in the comments
Please Login to comment...