Z-Score in Statistics is a measurement of how many standard deviations a data point is from the mean of a distribution. Let's find z score in statistics. A z-score of 0 indicates that the data point's score is the same as the mean score. A positive z-score indicates that the data point is above average, while a negative z-score indicates that the data point is below average.
The formula for calculating a z-score is: z = (x – μ)/ σ
Where:
- x: is the test value
- μ: is the mean
- σ: is the standard value
In this article, we are going to discuss the following concepts:
Table of Content
What is Z-Score?
The Z-score, also known as the standard score, tells us the deviation of a data point from the mean by expressing it in terms of standard deviations above or below the mean. It gives us an idea of how far a data point is from the mean. Hence, the Z-Score is measured in terms of standard deviation from the mean. For example, a Z-score of 2 indicates the value is 2 standard deviations away from the mean. To use a z-score, we need to know the population mean (μ) and also the population standard deviation (σ).
The Formula for Z-Score
A z-score can be calculated using the following formula.
z = (X - μ) / σ
where,
- z = Z-Score
- X = Value of Element
- μ = Population Mean
- σ = Population Standard Deviation
How to Calculate Z-Score?
We are given the population mean (μ), the population standard deviation (σ), and the observed value (x) in the problem statement substituting the same in the Z-score equation yields us the Z-Score value. Depending upon whether the given Z-Score is positive or negative, we can use positive Z-Table or negative Z-Table available online or on the back of your statistics textbook in the appendix.
Example 1:
You take the GATE examination and score 500. The mean score for the GATE is 390 and the standard deviation is 45. How well did you score on the test compared to the average test taker?
Solution:
Following data is readily available in the above question statement
Raw score/observed value = X = 500
Mean score = μ = 390
Standard deviation = σ = 45
By applying the formula of z-score,
z = (X - μ) / σ
z = (500 - 390) / 45
z = 110 / 45 = 2.44
This means that your z-score is 2.44.
Since the Z-Score is positive 2.44, we will make use of the positive Z-Table.
Now let's take a look at Z Table (CC-BY) to know how well you scored compared to the other test-takers.
Follow the instruction below to find the probability from the table.
Here, z-score = 2.44, which indicates that the data point is 2.44 standard deviations above the mean.
- Firstly, map the first two digits 2.4 on the Y-axis.
- Then along the X-axis, map 0.04
- Join both axes. The intersection of the two will provide you the cumulative probability associated with the Z-score value you're looking for
[This probability represents the area under the standard normal curve to the left of the Z-score]
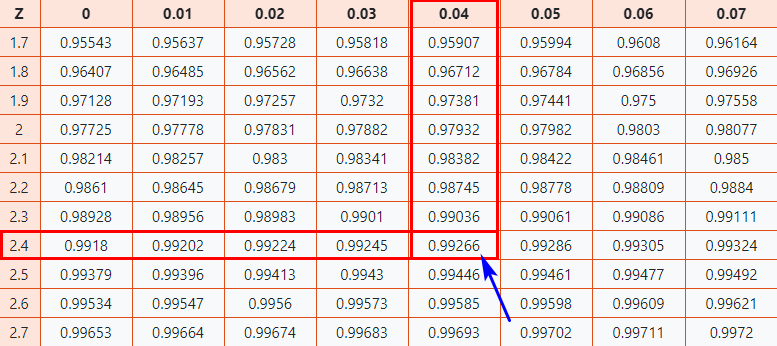
Normal distribution table
As a result, you will get the final value which is 0.99266.
Now, we need to compare how our original score of 500 on the GATE examination compares to the average score of the batch. To do that we need to convert the cumulative probability associated with the Z-score into a percentage value.
0.99266 × 100 = 99.266%
Finally, you can say that you have performed well than almost 99% of other test-takers.
Example 2: What is the probability that a student scores between 350 and 400 (with a mean score μ of 390 and a standard deviation σ of 45)?
Solution:
Min score = X1 = 350
Max score = X2 = 400
By applying the formula of z-score,
z1 = (X1 - μ) / σ
z1 = (350 - 390) / 45
z1 = -40 / 45 = -0.88
z2 = (X2 - μ) / σ
z2 = (400 - 390) / 45
z2 = 10 / 45 = 0.22
Since z1 is negative, we will have to look at a negative Z-Table and find that cumulative probability p1, the first probability, is 0.18943.
z2 is positive, so we use a positive Z-Table which yields a cumulative probability p2 of 0.58706.
The final probability is computed by subtracting p1 from p2:
p = p2 - p1
p = 0.58706 - 0.18943 = 0.39763
The probability that a student scores between 350 and 400 is 39.763% (0.39763 * 100).
Characteristics of Z-Score
- The magnitude of the Z-score reflects how far a data point is from the mean in terms of standard deviations.
- An element having a z-score of less than 0 represents that the element is less than the mean.
- Z-scores allow for the comparison of data points from different distributions.
- An element having a z-score greater than 0 represents that the element is greater than the mean.
- An element having a z-score equal to 0 represents that the element is equal to the mean.
- An element having a z-score equal to 1 represents that the element is 1 standard deviation greater than the mean; a z-score equal to 2, 2 standard deviations greater than the mean, and so on.
- An element having a z-score equal to -1 represents that the element is 1 standard deviation less than the mean; a z-score equal to -2, 2 standard deviations less than the mean, and so on.
- If the number of elements in a given set is large, then about 68% of the elements have a z-score between -1 and 1; about 95% have a z-score between -2 and 2; about 99% have a z-score between -3 and 3. This is known as the Empirical Rule, and it states the percentage of data within certain standard deviations from the mean in a normal distribution as demonstrated in the image below
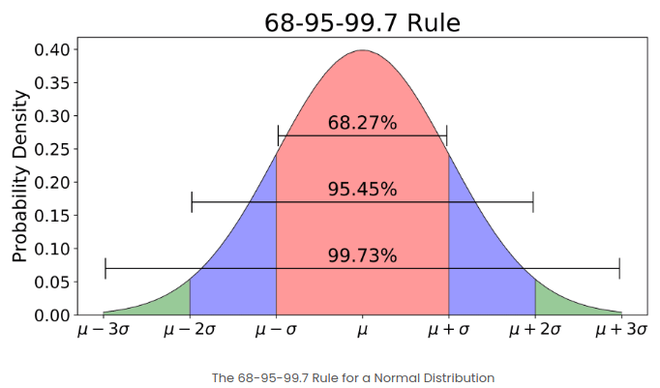
The empirical rule in Normal distribution
Calculate Outliers Using the Z-Score Value
We can calculate outliers in the data using the z-score value of the data points. The steps to consider an outlier data point are as :
- At first, we gather the dataset in which we want to see the outliers
- We will calculate the mean and standard deviation of the dataset, These values will be used to calculate the z-score value of each data point.
- We will calculate the z-score value for each data point. The formula for calculating the z-score value will be the same as
[Tex]Z = \frac{{X - \mu}}{{\sigma}}[/Tex]
where X will be the data point, μ is the mean of the data, and σ is the standard deviation of the dataset. - We will determine the cutoff value for the z-score after which the data point could be considered as an outlier. This cutoff value is a hyperparameter that we decide depending on our project.
- A data point whose z-score value is greater than 3 means the data point does not belong to the 99.73 % point of the dataset.
- Any data point whose z-score is greater than our decided cutoff value will be considered an outlier.
Check: Z score for Outlier Detection
Implementation of Z-Score in Python
We can use Python to calculate the z-score value of data points in the dataset. Also, we will use the numpy library to calculate mean and standard deviation of the dataset.
import numpy as np

def calculate_z_score(data):
  # Mean of the dataset
    mean = np.mean(data)
   # Standard Deviation of tha dataset
    std_dev = np.std(data)
   # Z-score of tha data points
    z_scores = (data - mean) / std_dev
    return z_scores

# Example dataset
dataset = [3,9, 23, 43,53, 4, 5,30, 35, 50, 70, 150, 6, 7, 8, 9, 10]
z_scores = calculate_z_score(dataset)
print('Z-Score :',z_scores)

# Data points which lies outside 3 standard deviatioms are outliers
# i.e outside range of99.73% values
outliers = [data_point for data_point, \
          z_score in zip(dataset, z_scores) if z_score > 3]
print(f'\nThe outliers in the dataset is {outliers}')
Output:
Z-Score : [-0.7574907  -0.59097335 -0.20243286  0.35262498  0.6301539  -0.72973781
 -0.70198492 -0.00816262  0.13060185  0.54689523  1.10195307  3.32218443
 -0.67423202 -0.64647913 -0.61872624 -0.59097335 -0.56322046]
The outliers in the dataset is [150]
Application of Z-Score
- Z-scores are often used for feature scaling to bring different features to a common scale. Normalizing features ensures that they have zero mean and unit variance, which can be beneficial for certain machine learning algorithms, especially those that rely on distance measures.
- Z-scores can be used to identify outliers in a dataset. Data points with Z-scores beyond a certain threshold (usually 3 standard deviations from the mean) may be considered outliers.
- Z-scores can be used in anomaly detection algorithms to identify instances that deviate significantly from the expected behaviour.
- Z-scores can be applied to transform skewed distributions into more normal distributions.
- When working with regression models, Z-scores of residuals can be analysed to check for homoscedasticity (constant variance of residuals).
- Z-scores can be used in feature scaling by looking at their standard deviations from the mean.
Z-Scores vs. Standard Deviation
Z- Score | Standard Deviation |
|---|---|
Transform raw data into a standardized scale. | Measures the amount of variation or dispersion in a set of values. |
Makes it easier to compare values from different datasets because they take away the original units of measurement. | Standard Deviation retains the original units of measurement, making it less suitable for direct comparisons between datasets with different units. |
Indicate how far a data point is from the mean in terms of standard deviations, providing a measure of the data point's relative position within the distribution | Expressed in the same units as the original data, providing an absolute measure of how spread out the values are around the mean |
Check: Z-Score Table
Why are Z-scores Called Standard Scores?
Z-scores are also known as standard scores because they standardize the value of a random variable. This means that the list of standardized scores has a mean of 0 and a standard deviation of 1.0. Z-scores also allow for the comparison of scores on different kinds of variables. This is because they use relative standing to equate scores from different variables or distributions.
Z-scores are frequently used to compare a variable to a standard normal distribution (with μ = 0 and σ = 1).
Z-Score in Statistics - FAQs
What is the significance of positive and negative Z-Scores?
Positive Z-Scores indicate values above the mean, while negative Z-Scores indicate values below the mean. The sign reflects the direction of deviation from the mean.
What does a Z-Score of 0 mean?
A Z-Score of 0 indicates that the data point's value is exactly at the mean of the dataset. It suggests that the data point is neither above nor below the mean.
What is the 68-95-99.7 Rule in relation to Z-Scores?
The 68-95-99.7 Rule, also known as the Empirical Rule, states that:
- About 68% of data falls within 1 standard deviation from the mean.
- About 95% falls within 2 standard deviations.
- About 99.7% falls within 3 standard deviations.
Can Z-Scores be used for non-normal distributions?
Z-Scores are based on the assumption that the data follows a normal distribution. However, in practice, Z-Scores are beneficial for data that follows a normal distribution. While Z-Scores may be calculated for any distribution, their interpretation becomes less reliable and straightforward when dealing with non-normally distributed data.
How can Z-Scores be applied in real-life situations?
Z-Scores have various applications, such as in finance for portfolio analysis, education for standardized testing, health for clinical assessments, and more. They provide a standardized measure for comparing and interpreting data.