What-if analysis is the option available in Data. In what-if analysis, by changing the input value in some cells you can see the effect on output. It tells about the relationship between input values and output values. In this article, we will learn how to use the what-if analysis with data tables effectively.
What is What-if Analysis?
What-if analysis is a procedure in excel in which we work in tabular form data. In the What-if analysis variety of values have been in the cell of the excel sheet to see the result in different ways by not creating different sheets. There are three tools of what-if analysis.
Tools of what-if analysis
There are three tools in what-if analysis:
- Goal seek
- Scenario manager
- Data Table
Goal seek
In goal seek we already know our output value we have to find the correct input value. For example, if a student wants to know his English marks and he knows all the rest of the marks and total marks in all subjects.
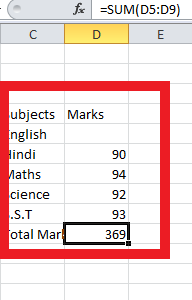
Step 1: Write all subjects and their marks in an excel sheet and do the sum by applying the formula sum.
Step 2: Go into the data tab of the Toolbar.
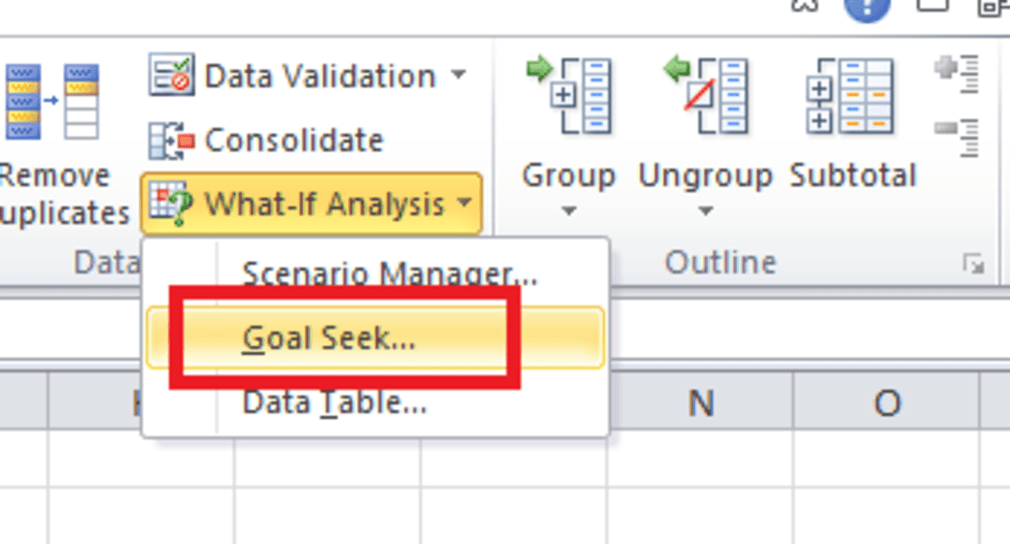
Step 3: Under the Data Table section, Select the What-if analysis.
Step 4: A drop-down appears. Select the Goal Seek.
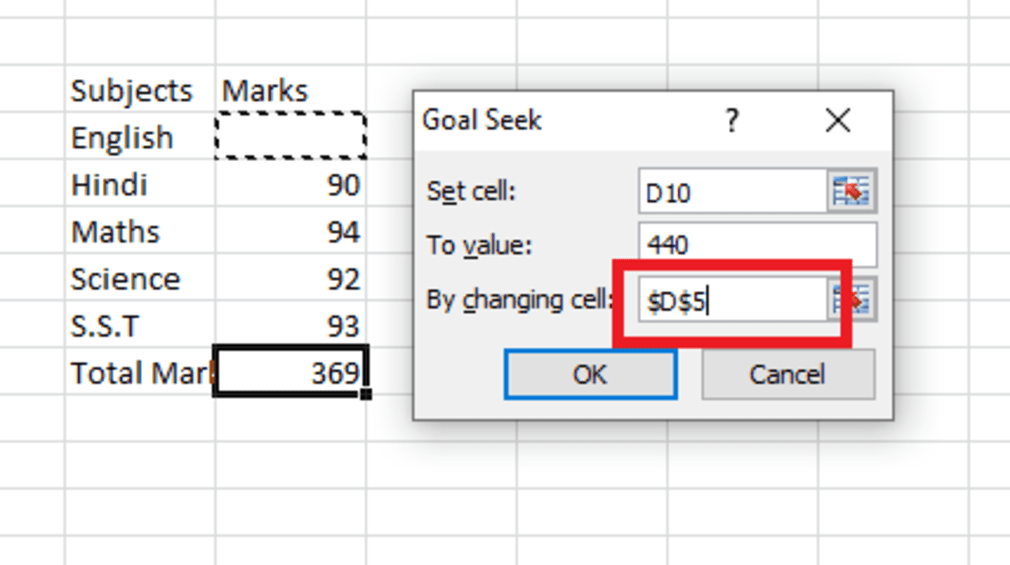
Step 5: The dialogue box appears in the first column write the name of the cell in which you apply the formula sum. Type D10 in Set cell.
Step 6: In the second column write the value of the target. The target value for this example is 440.
Step 7: In the third column write the name of the cell in which you want to get marks in English. Provide absolute cell reference, i.e. $D$5.
Step 8: Click ok and see the result. The estimated marks for English are 71.
Scenario Manager
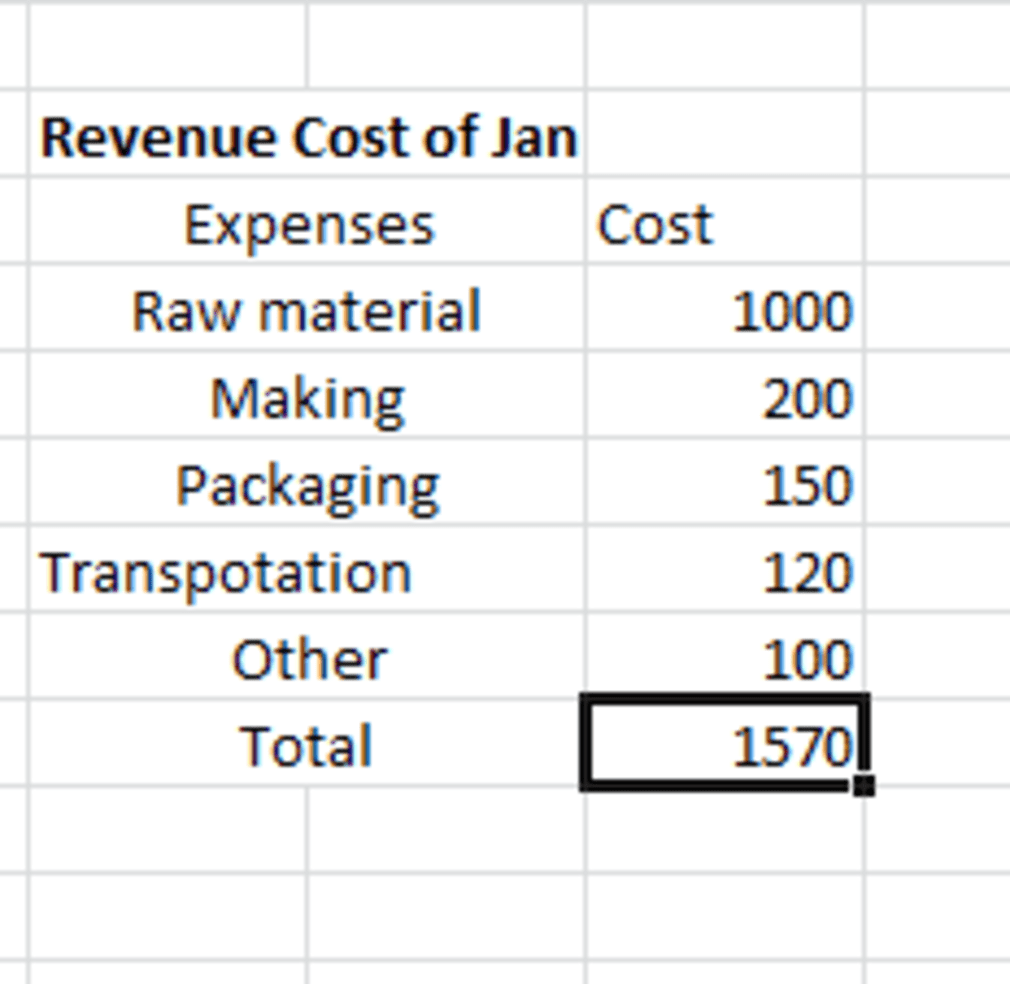
In scenario manager, we create different scenarios by proving different input values for the same variable than by comparing scenarios to choose the correct result. For Example, To check the cost of revenue for three different months.
Step 1: Given a data set, for Revenue Cost of Jan, with Expenses and Cost as its columns.
Step 2: Select the numerical value cell and Go to the Data.
Step 3: Under the forecast section, click on the What-if analysis.
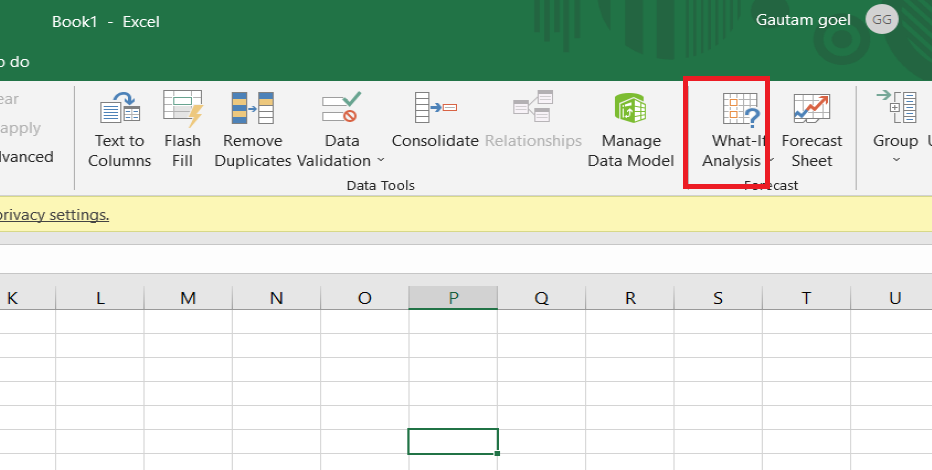
Step 4: A drop-down appears. Select the Scenario manager.
Step 5: A dialog box appears in the dialog box select add option.
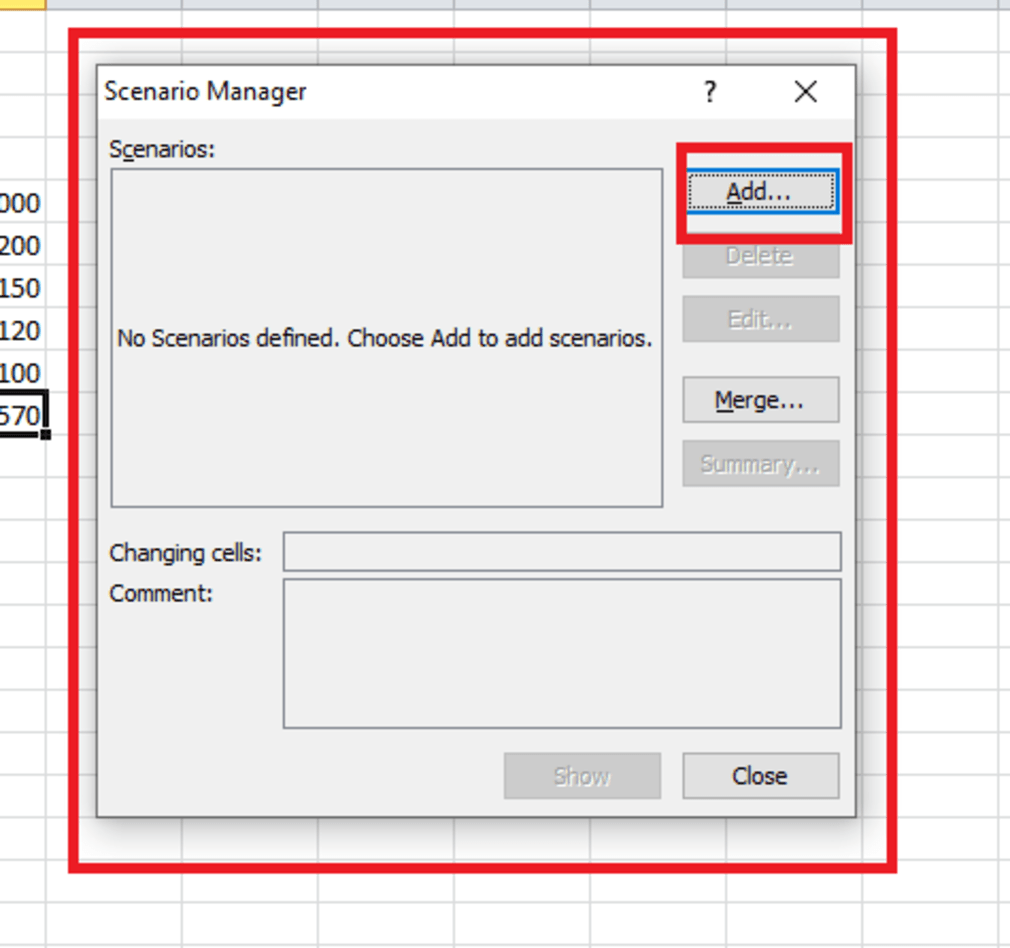
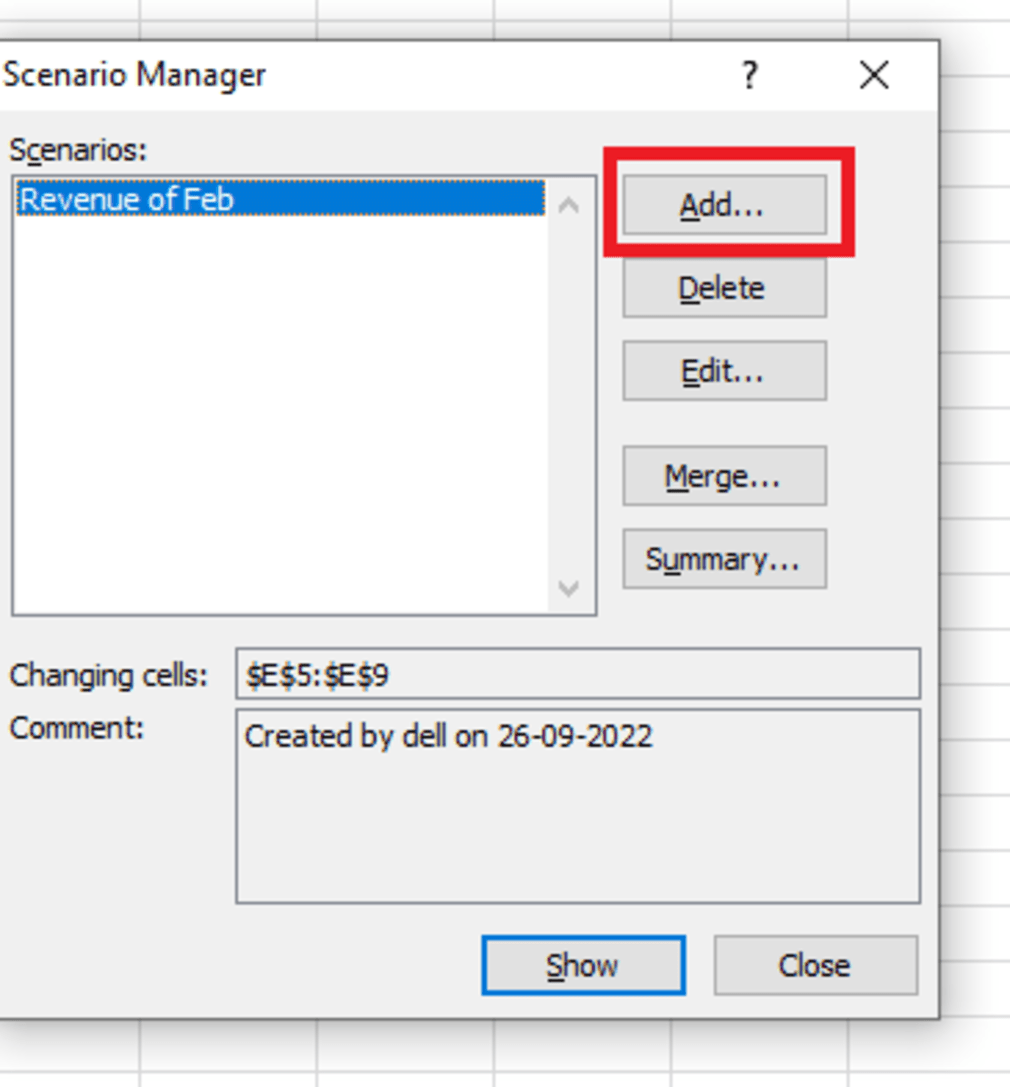
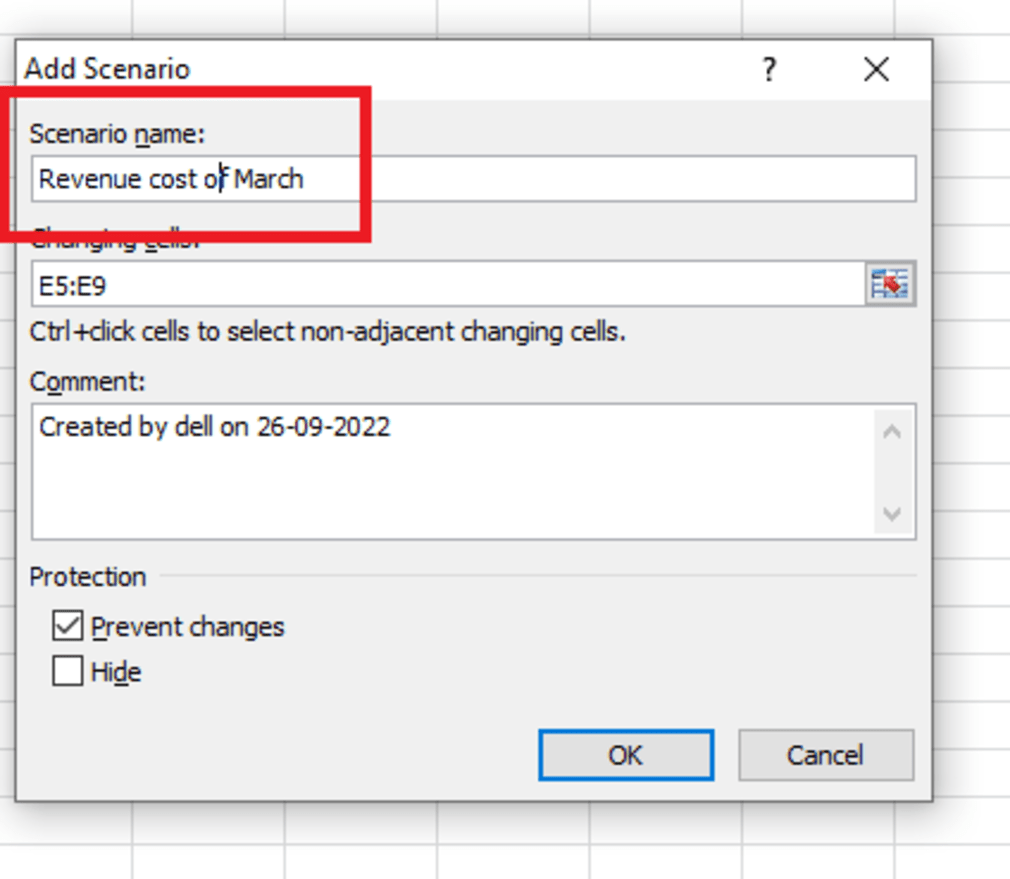
Step 6: A new dialog appears to write the name of the new scenario in the first column. Under Scenario name, write “Revenue of Feb”.
Step 7: In the second column select the changing cell. The changing cells for this example, are $E$5:$E$9.
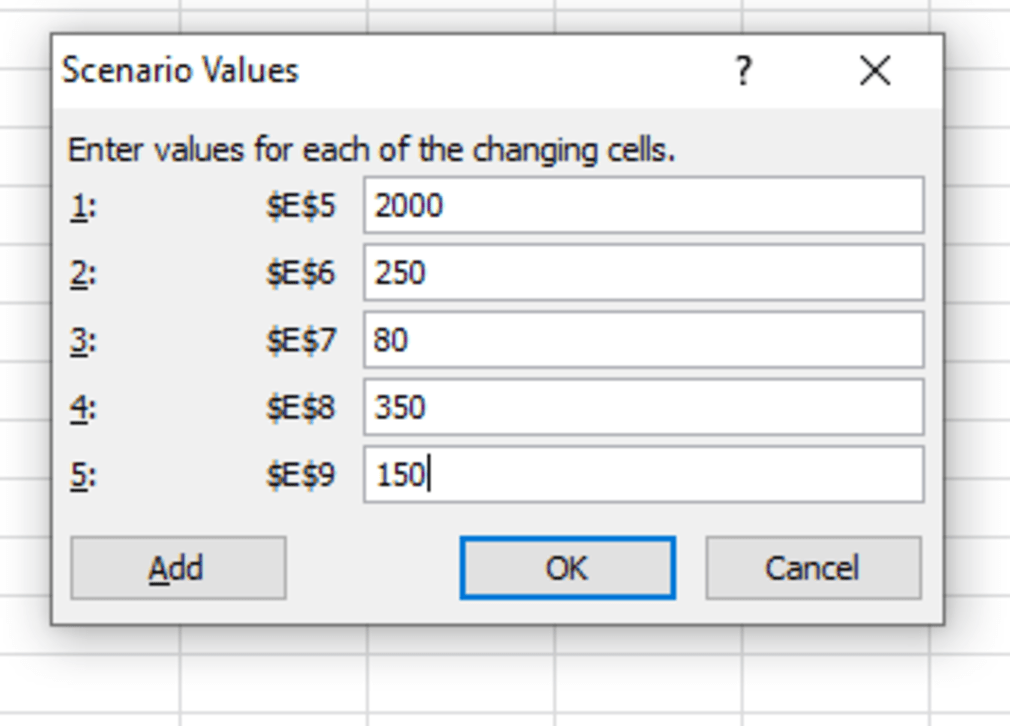
Step 8: A new dialogue box name Scenario Values appears to write the changed value in the box. Enter the values as per shown in the image. Click Ok.
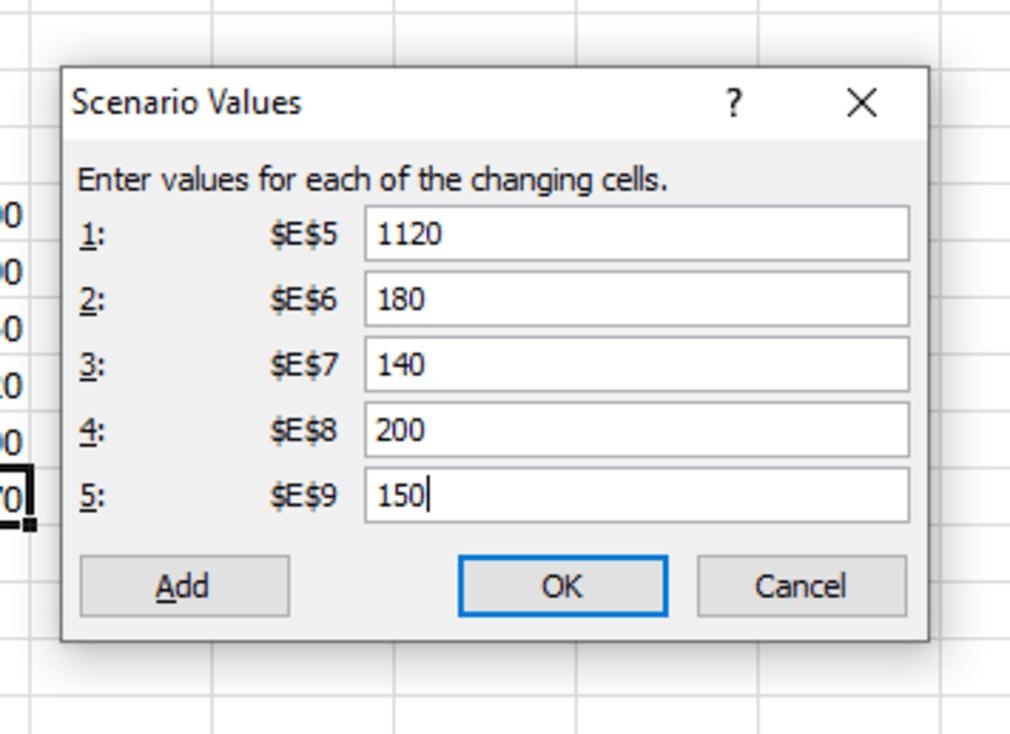
Step 9: Repeat step5, step6, and step8.
Step 10: Click Ok then select summary.
Step 11: A new Dialog box name Scenario Summary appears. Select Result cells: $E$10.
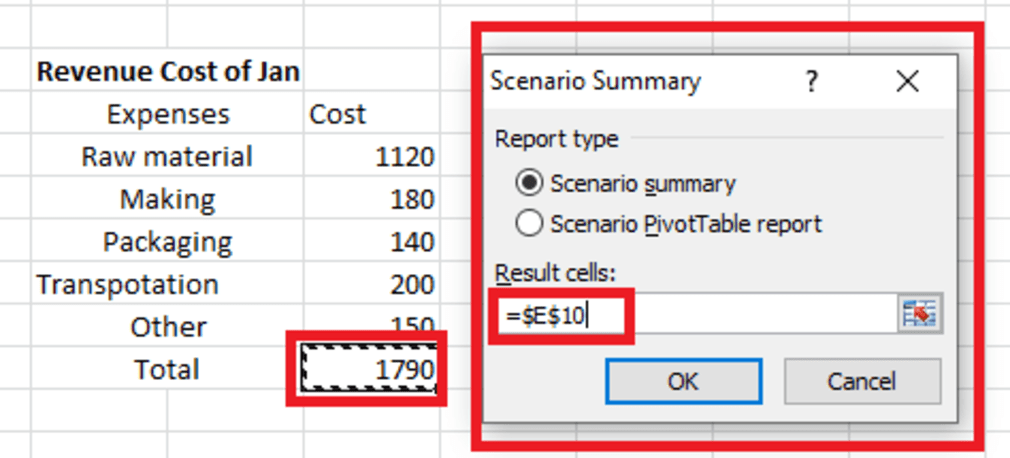
Step 12: See the result.
Data Table
In data, we create a table with different input values for the same variables. It is one of the most helpful features in what-if analysis. One can change different values in x and can achieve different outputs accordingly for research as well as business-driven purposes.
A data table is of two types:
Data table in one Variable
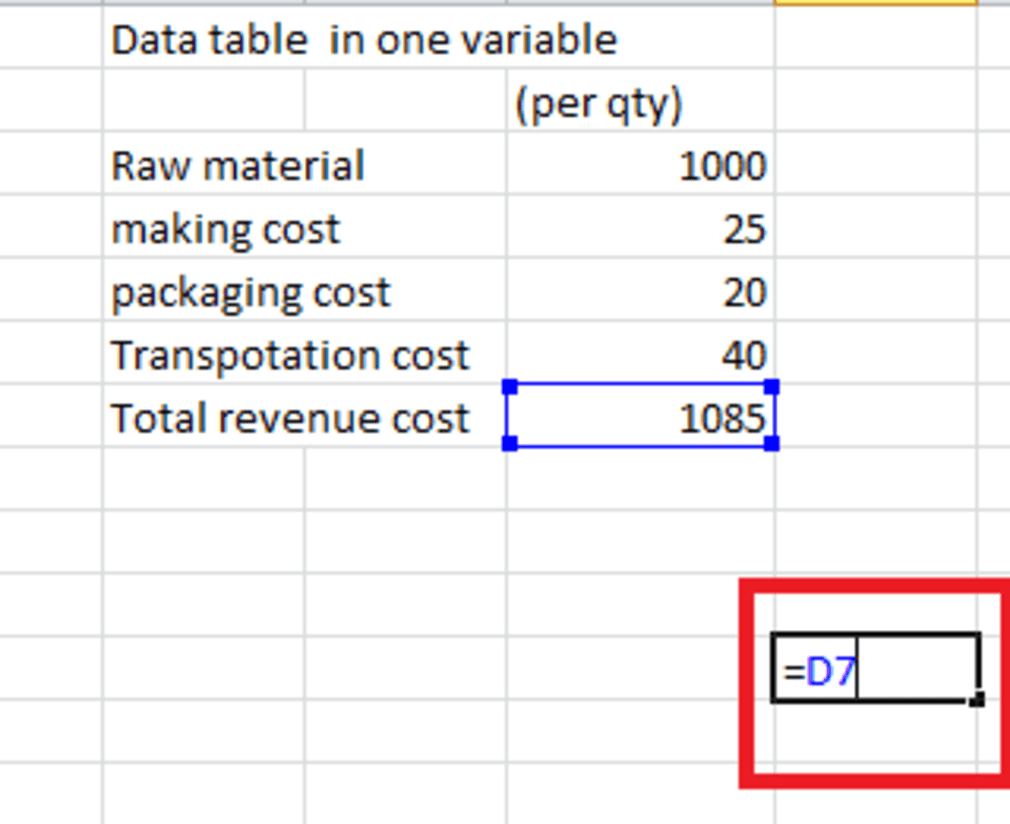
In the data table in one variable, we can change only one input value either in a row or in a column. It includes only one input cell. For example, a company wants to know about its revenue by changing the cost of raw materials by using a data table. Given a data set, with material and their cost.
Step 1: Create a table of revenue cost.
Step 2: Copy the last cell in which you get output in another cell. D7 for this example.
Step 3: Write the values in the cell for which you want to make a change in a column or in rows.
Step 4: Go to the data tab of the Toolbar.
Step 5: Under the data table section, Select the what-if analysis.
Step 6: A drop-down appears. Select the Data Table.
Step 7: A dialogue box name data table appears then select the cell in which you want to change the input value in a row or in the column. Input the value of the Column input cell to be $D$3. Click Ok. Your data table is ready.
Data table in two Variable
In the Data table in two variables, we can change two input values in both row and column. It includes two input cells. For example, A person wants to know about per month installments of loan by the different rates of interest and for the different time periods for the same principal amount.
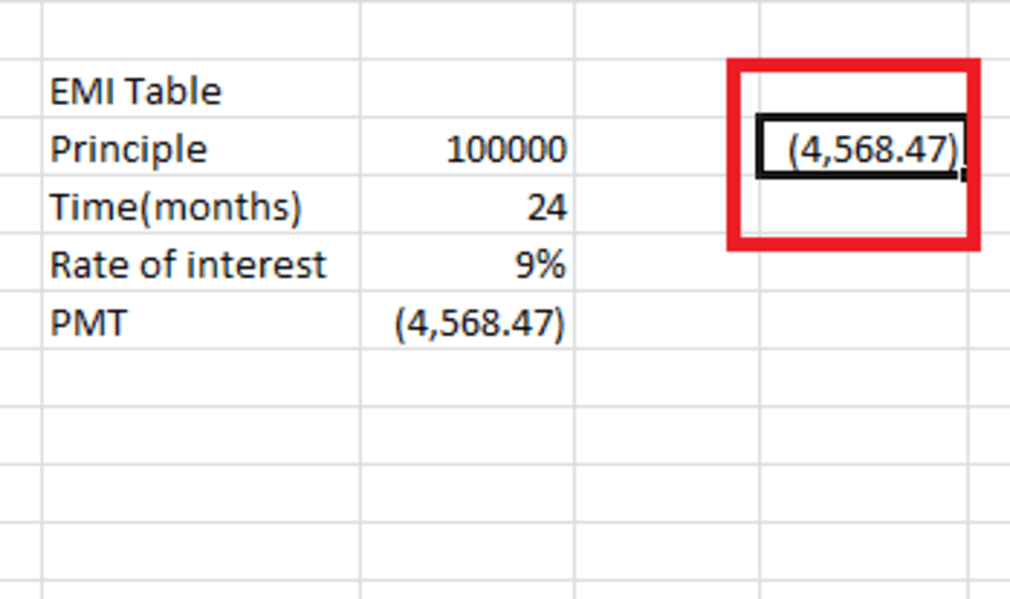
Step 1: Create a table to find PMT.
Step 2: Copy the last cell in which you get output in another cell
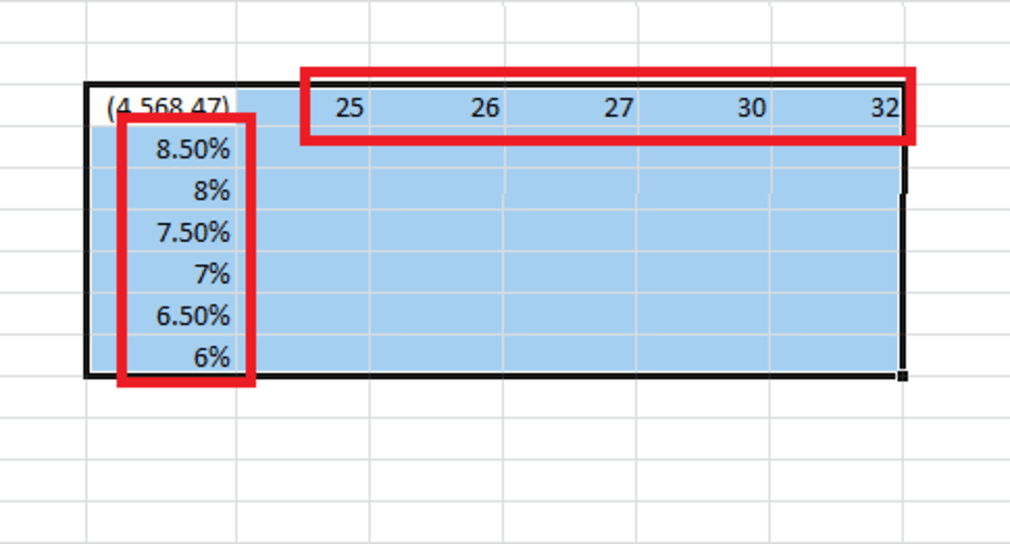
Step 3: Write both values you want to change in both columns and rows.
Step 4: Go to the Data tab of the toolbar.
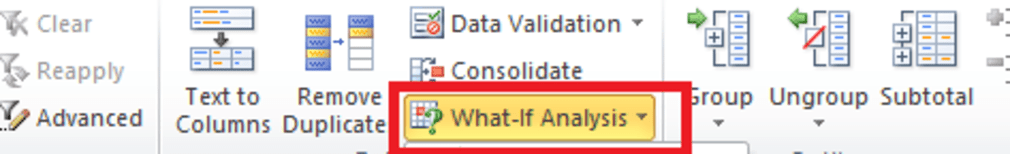
Step 5: Select the what-if analysis.
Step 6: Select the Data Table.
Step 7: A dialogue box appears in which you have to select the cell in which you want to change the value in both row and column. The Row input cell value is $D$5 and the column input cell value is $D$6.
Step 8: Click ok and see the result.