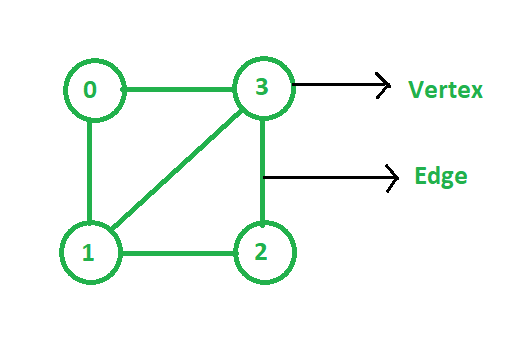
A Graph is a non-linear data structure used for the representation of a set of objects where some pairs of objects are connected. The interconnected objects are represented by points called vertices, and the line that connects the vertices are called edges. Vertices are represented by V and edges are represented by E. It can also be said that a graph is a pair of sets (V, E). For Example:
In the above Graph, the set of vertices V = {0, 1, 2, 3} and the set of edges E = {(0, 1), (0, 3), (1, 2), (1, 3), (2, 3)}.
Some observations of a graph are:
- The maximum number of edges in an undirected graph of N vertices without considering self-loops: Since every node can connect to all other nodes, the first node can connect to (N – 1) nodes. The second node can connect to (N – 2) nodes and so on. Therefore,
The total number of edges are: 1 + 2 + 3 + ··· + N = N*(N – 1)/2 edges
- The maximum number of edges in a directed graph of N vertices without considering the self-loops: Each edge has its starting vertex and ending vertex. There are N choices for the starting vertex. Since there are no self-loops, there are (N – 1) choices for the ending vertex. So by multiplying these choices together to count all possible choices. Therefore,
The total number of edges are: N*(N – 1)
- The maximum number of edges in a graph with N vertices with self-loop:
The total number of edges are: N*N
- The minimum number of edges in an undirected graph with N vertices: Since the graph is connected then there must be a unique path from every vertex to every other vertex and removing any edge will make the graph disconnected. The minimum is achieved by placing 1 in each row of the upper triangle. Now, if the adjacency matrix is of dimension NxN, the first row has (N – 1) elements in the upper triangle, the second has (N – 2) elements in the upper triangle, so on. and the last row has 0 elements in the upper triangle. That is, there are (N – 1) total rows “with an upper triangle”, each with only 1. Therefore,
The total number of edges are: (N – 1)
- The number of adjacency matrices possible for an unweighted graph with N vertices and E edges: For an unweighted graph with N vertices, it can be represented as an (NxN) matrix (2D array) with each value being either 0 (that denotes the non-existence of an edge) or 1(that denotes the existence of an edge).
Now, if there are N different choices on the first row, there are (N – 1) choices on the second row (as information about the edges 1, 2 is known), and so on. So the total possibilities are:
N*(N – 1)*(N – 2)* … *1 = N!
Or it can be said that it is equal to the number of permutations of N elements i.e., N!.
- The number of adjacency lists possible for a graph with N vertices and E edges: Similar to the above explanation. It’s equal to the number of permutations of edges i.e., E!.
- Let G be a graph in which all vertices have a degree of at least two. Then G contains a cycle: Assume G is simple and let P be the longest path as (v0v1v2…va−1va). As it is given that the degree of va is > 2, va must be adjacent to at least one vertex v that is not (va – 1), if v ∉ {v0, …, va − 2}, then it could extend the path P to v. However, P was chosen to be of maximal length, so this is impossible, and therefore v ∈ {v0…, va – 2}. Thus, if v = vi, then vi+1, …, va, viis a cycle.
- Cayley’s formula:
For N ≤ 1, there are precisely NN – 2 tree graphs on N-la belled vertices.