in
R Programmingis an Unsupervised Non-linear algorithm that cluster data based on similarity or similar groups. It seeks to partition the observations into a pre-specified number of clusters. Segmentation of data takes place to assign each training example to a segment called a cluster. In the unsupervised algorithm, high reliance on raw data is given with large expenditure on manual review for review of relevance is given. It is used in a variety of fields like Banking, healthcare, retail, Media, etc.
Theory
K-Means clustering groups the data on similar groups. The algorithm is as follows:
- Choose the number K clusters.
- Select at random K points, the centroids(Not necessarily from the given data).
- Assign each data point to closest centroid that forms K clusters.
- Compute and place the new centroid of each centroid.
- Reassign each data point to new cluster.
After final reassignment, name the cluster as Final cluster.
The Dataset
Iris
dataset consists of 50 samples from each of 3 species of Iris(Iris setosa, Iris virginica, Iris versicolor) and a multivariate dataset introduced by British statistician and biologist Ronald Fisher in his 1936 paper The use of multiple measurements in taxonomic problems. Four features were measured from each sample i.e length and width of the sepals and petals and based on the combination of these four features, Fisher developed a linear discriminant model to distinguish the species from each other.
# Loading data
data(iris)

# Structure
str(iris)

Performing K-Means Clustering on Dataset
Using K-Means Clustering algorithm on the dataset which includes 11 persons and 6 variables or attributes
# Installing Packages
install.packages("ClusterR")
install.packages("cluster")

# Loading package
library(ClusterR)
library(cluster)

# Removing initial label of
# Species from original dataset
iris_1 <- iris[, -5]

# Fitting K-Means clustering Model
# to training dataset
set.seed(240) # Setting seed
kmeans.re <- kmeans(iris_1, centers = 3, nstart = 20)
kmeans.re

# Cluster identification for
# each observation
kmeans.re$cluster

# Confusion Matrix
cm <- table(iris$Species, kmeans.re$cluster)
cm

# Model Evaluation and visualization
plot(iris_1[c("Sepal.Length", "Sepal.Width")])
plot(iris_1[c("Sepal.Length", "Sepal.Width")],
     col = kmeans.re$cluster)
plot(iris_1[c("Sepal.Length", "Sepal.Width")],
     col = kmeans.re$cluster,
     main = "K-means with 3 clusters")

## Plotiing cluster centers
kmeans.re$centers
kmeans.re$centers[, c("Sepal.Length", "Sepal.Width")]

# cex is font size, pch is symbol
points(kmeans.re$centers[, c("Sepal.Length", "Sepal.Width")],
       col = 1:3, pch = 8, cex = 3)

## Visualizing clusters
y_kmeans <- kmeans.re$cluster
clusplot(iris_1[, c("Sepal.Length", "Sepal.Width")],
         y_kmeans,
         lines = 0,
         shade = TRUE,
         color = TRUE,
         labels = 2,
         plotchar = FALSE,
         span = TRUE,
         main = paste("Cluster iris"),
         xlab = 'Sepal.Length',
         ylab = 'Sepal.Width')
Output:
- Model kmeans_re:
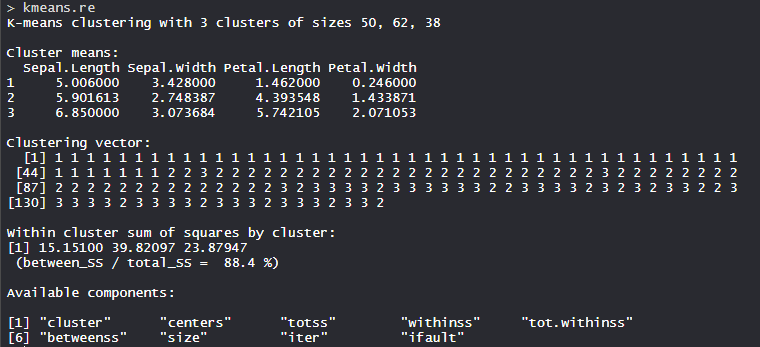 The 3 clusters are made which are of 50, 62, and 38 sizes respectively. Within the cluster, the sum of squares is 88.4%.
 - Cluster identification:
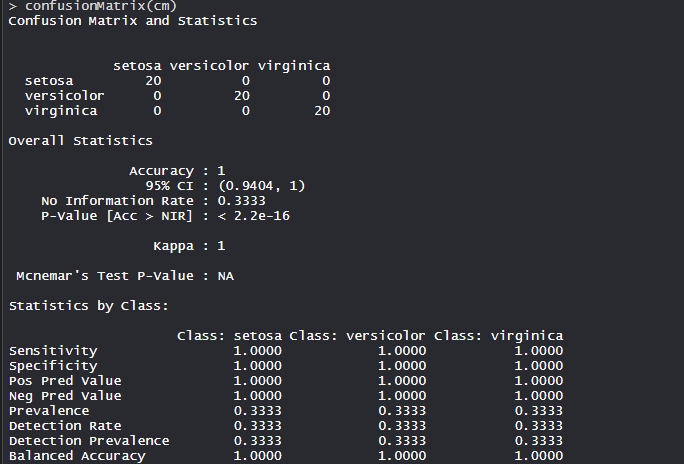 The model achieved an accuracy of 100% with a p-value of less than 1. This indicates the model is good.
 - Confusion Matrix:
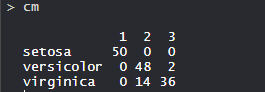 So, 50 Setosa are correctly classified as Setosa. Out of 62 Versicolor, 48 Versicolor are correctly classified as Versicolor and 14 are classified as virginica. Out of 36 virginica, 19 virginica are correctly classified as virginica and 2 are classified as Versicolor.
 - K-means with 3 clusters plot:
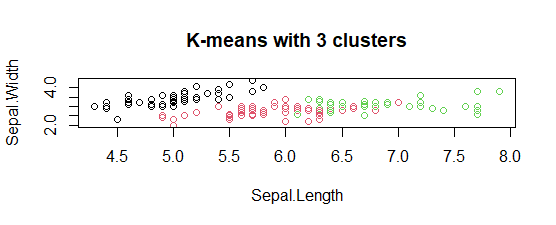 The model showed 3 cluster plots with three different colors and with Sepal.length and with Sepal.width.
 - Plotting cluster centers:
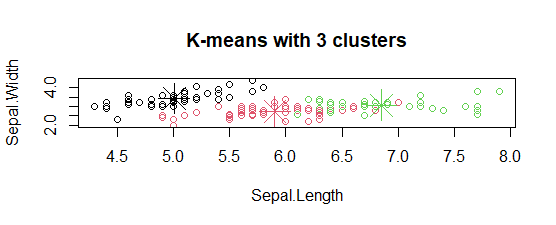 In the plot, centers of clusters are marked with cross signs with the same color of the cluster.
 - Plot of clusters:
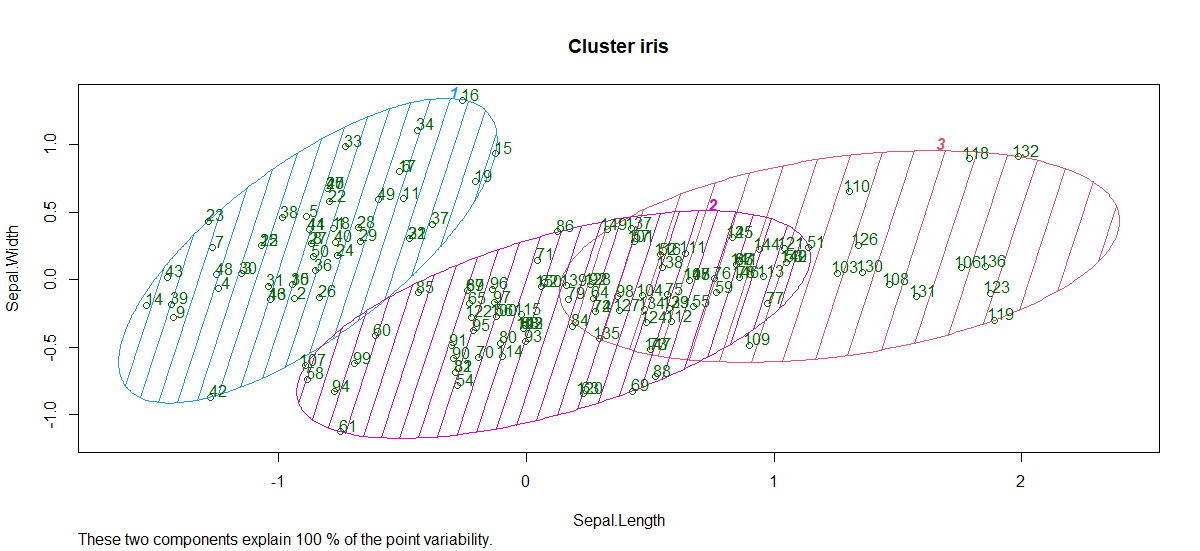
So, 3 clusters are formed with varying sepal length and sepal width. Hence, the K-Means clustering algorithm is widely used in the industry.