In machine learning, confidence intervals play a crucial role in quantifying the uncertainty associated with model predictions and parameter estimates. They provide a range of values within which we can be confident that the true value lies, given a certain level of probability. In this article, we will see confidence intervals relevance in Machine Learning.
What are Confidence Intervals?
A confidence interval is a range of values that likely contains the true population parameter, such as the population mean or proportion, based on a sample from that population and a specified level of confidence.
For example, if we calculate a 95% confidence interval for the mean test scores of students, it means that we are 95% confident that the true population mean lies within that interval.
import numpy as np
import matplotlib.pyplot as plt

# Sample data
np.random.seed(42)
sample_data = np.random.normal(loc=80, scale=10, size=100)  # mean=80, std=10, sample size=100

# Calculate sample statistics
sample_mean = np.mean(sample_data)
sample_std = np.std(sample_data)
sample_size = len(sample_data)

# Confidence level
confidence_level = 0.95

# Calculate z-score for 95% confidence level
z_score = 1.96  # approximate z-score for 95% confidence

# Margin of error
margin_of_error = z_score * (sample_std / np.sqrt(sample_size))

# Confidence interval
confidence_interval = (sample_mean - margin_of_error, sample_mean + margin_of_error)

# Visualize the confidence interval
plt.figure(figsize=(8, 6))
plt.hist(sample_data, bins=20, alpha=0.7, color='skyblue', edgecolor='black')
plt.axvline(confidence_interval[0], color='red', linestyle='--', label='Lower CI')
plt.axvline(confidence_interval[1], color='red', linestyle='--', label='Upper CI')
plt.axvline(sample_mean, color='black', linestyle='-', label='Sample Mean')
plt.xlabel('Test Scores')
plt.ylabel('Frequency')
plt.title('Histogram with 95% Confidence Interval')
plt.legend()
plt.show()

# Print the confidence interval
print("Confidence Interval (95%):", confidence_interval)
Output:
Confidence Interval (95%): (77.1904471198356, 80.73262253228253)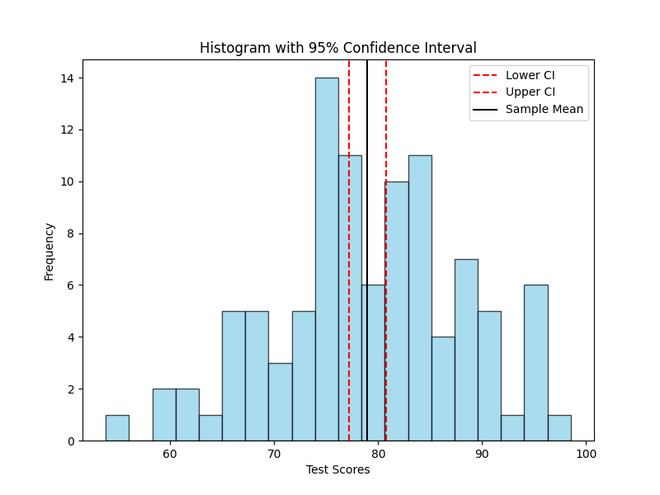
Visualize the CI
1. For Population Mean (Known Standard Deviation):
The confidence interval for the population mean when the standard deviation is known is calculated using the formula:
[Tex]\text{Confidence Interval} = \bar{x} \pm z \left( \frac{\sigma}{\sqrt{n}} \right)
[/Tex]
Where,
- CI is the confidence interval, showing the range of likely values for the population mean.
- [Tex]\bar{x}[/Tex] is the sample mean, which we calculate from our data.
- z is the z-score, a number we get from statistical tables based on our desired confidence level (e.g., 1.96 for 95% confidence).
- σ is the known population standard deviation.
- n is the sample size.
2. For Population Mean (Unknown Standard Deviation):
The confidence interval for the population mean when the standard deviation is unknown is calculated using the t-distribution instead of the standard normal distribution.
[Tex]\text{Confidence Interval} = \bar{x} \pm t \left( \frac{s}{\sqrt{n}} \right) [/Tex]
Where,
- t is the t-score, which we find from the t-distribution table based on our desired confidence level and degrees of freedom (DF = n−1).
- s is the sample standard deviation, calculated from our data.
3. For Population Proportion: The confidence interval for a population proportion p is calculated using the formula
[Tex]\text{Confidence Interval} = \hat{p} \pm z \sqrt{\frac{\hat{p}(1-\hat{p})}{n}}
[/Tex]
Where,
- p is the sample proportion, representing the proportion of successes in our sample.
- z is the z-score, obtained from statistical tables based on our chosen confidence level.
- n is the sample size.
What are features of Confidence Interval ?
- Range of Values: A confidence interval gives us a range of values, not just a single number, to estimate where the true population parameter might lie.
- Level of Confidence: It tells us how confident we are that the true parameter falls within that range. For example, a 95% confidence interval means we are 95% confident the true parameter is in the interval.
- Based on Sample Data: Confidence intervals are calculated based on a sample from the population, not the entire population itself.
- Quantifies Uncertainty: They help quantify the uncertainty or variability in our estimates, considering that samples can vary from one another.
- Statistical Tool: Confidence intervals are a statistical tool used to make inferences about population parameters from sample data.
- Interpretation: It's important to interpret confidence intervals correctly. They do not give the probability that the true parameter is within the interval; instead, they reflect the long-term success rate of the estimation procedure.
How to Calculate Confidence Interval (CI)?
1. For Population Mean (Known Population Standard Deviation):
- Collect Data: Obtain a sample of data from the population you're interested in.
- Calculate Sample Mean: Compute the average (mean) of your sample data.
- Determine Sample Size: Count the number of observations in your sample (denoted as n).
- Choose Confidence Level: Decide on the level of confidence you want (e.g., 95%, 99%).
- Find Z-Score: Look up the z-score corresponding to your chosen confidence level. For example, for 95% confidence, the z-score is approximately 1.96.
- Calculate Margin of Error: Use the formula Margin of Error = z ✖ (𝞂 / √ n ) where 𝞂 is the known population standard deviation.
- Compute Confidence Interval: The confidence interval is then given by CI = Sample Mean ∓ Margin of Error.
import scipy.stats as stats

# Sample data
sample_data = [86, 88, 84, 90, 85, 87, 89, 82, 91, 83]

# Calculate sample statistics
sample_mean = sum(sample_data) / len(sample_data)
population_std = 5  # example: known population standard deviation
sample_size = len(sample_data)

# Confidence level
confidence_level = 0.95

# Z-score for 95% confidence level
z_score = stats.norm.ppf((1 + confidence_level) / 2)

# Margin of error
margin_of_error = z_score * (population_std / (sample_size ** 0.5))

# Confidence interval
confidence_interval = (sample_mean - margin_of_error, sample_mean + margin_of_error)
print("Confidence Interval (Population Mean):", confidence_interval)
Output:
Confidence Interval (Population Mean): (83.4010248384772, 89.5989751615228)The confidence interval (83.4010248384772, 89.5989751615228) for a population mean represents a range of values within which we are reasonably confident that the true population mean lies. Specifically, this interval indicates that if we were to take multiple samples from the same population and calculate a confidence interval for the population mean from each sample, about 95% of those intervals would contain the true population mean.
2. For Population Mean (Unknown Population Standard Deviation)
Following the same steps as above, but instead of using the z-score, you'll use the t-score from the t-distribution based on n−1 degrees of freedom.
import scipy.stats as stats

# Sample data
sample_data = [86, 88, 84, 90, 85, 87, 89, 82, 91, 83]

# Calculate sample statistics
sample_mean = sum(sample_data) / len(sample_data)
sample_std = stats.tstd(sample_data)  # using sample standard deviation
sample_size = len(sample_data)

# Confidence level
confidence_level = 0.95

# T-score for 95% confidence level and (n-1) degrees of freedom
t_score = stats.t.ppf((1 + confidence_level) / 2, df=sample_size-1)

# Margin of error
margin_of_error = t_score * (sample_std / (sample_size ** 0.5))

# Confidence interval
confidence_interval = (sample_mean - margin_of_error, sample_mean + margin_of_error)
print("Confidence Interval (Population Mean - Unknown Std Dev):", confidence_interval)
Output:
Confidence Interval (Population Mean - Unknown Std Dev): (84.33414941027831, 88.66585058972169)The confidence interval (84.33414941027831, 88.66585058972169) for a population mean when the standard deviation is unknown represents a range of values within which we are reasonably confident that the true population mean lies. Similar to the previous explanation, this interval indicates that if we were to take multiple samples from the same population and calculate a confidence interval for the population mean from each sample, about 95% of those intervals would contain the true population mea
3. For Population Proportion
- Collect Data: Obtain a sample of binary data where you know the number of successes (e.g., heads in coin flips, positive outcomes).
- Calculate Sample Proportion: Divide the number of successes by the total sample size to get the sample proportion (P^).
- Determine Sample Size: Count the number of observations in your sample (denoted as n).
- Choose Confidence Level: Decide on the level of confidence you want (e.g., 95%, 99%).
- Find Z-Score: Look up the z-score corresponding to your chosen confidence level.
- Calculate Margin of Error: Use the formula Margin of Error .
- Compute Confidence Interval: The confidence interval is then given by CI = p^ ∓ Margin of Error .
import scipy.stats as stats

# Sample data
successes = 35  # number of successes
total_obs = 50  # total sample size

# Calculate sample proportion
sample_proportion = successes / total_obs

# Confidence level
confidence_level = 0.95

# Z-score for 95% confidence level
z_score = stats.norm.ppf((1 + confidence_level) / 2)

# Margin of error
margin_of_error = z_score * ((sample_proportion * (1 - sample_proportion)) / total_obs) ** 0.5

# Confidence interval
confidence_interval = (sample_proportion - margin_of_error, sample_proportion + margin_of_error)
print("Confidence Interval (Population Proportion):", confidence_interval)
Output:
Confidence Interval (Population Proportion): (0.5729798163797764, 0.8270201836202236)The confidence interval (0.5729798163797764, 0.8270201836202236) for a population proportion represents a range of values within which we are reasonably confident that the true population proportion lies. Specifically, this interval indicates that if we were to take multiple samples from the same population and calculate a confidence interval for the population proportion from each sample, about 95% of those intervals would contain the true population proportion.
Applications of Confidence Intervals (CIs)
- Medical Research: Estimate treatment effects or medical outcomes in clinical trials.
- Market Research: Determine customer satisfaction levels or voting preferences.
- Quality Control: Assess manufacturing process variation and product quality.
- Finance and Economics: Predict financial indicators like stock prices or GDP growth rates.
- Environmental Studies: Evaluate pollution levels, wildlife populations, or climate impacts.
- Education and Testing: Estimate student performance and evaluate educational interventions.
- Predictive Modeling: Assess uncertainty in machine learning model predictions.
Conclusion
Confidence intervals are essential tools in machine learning and statistical analysis. They help us understand the uncertainty associated with our estimates, assess the significance of model parameters, and make informed decisions based on reliable data. By providing a range of likely values for population parameters and model predictions, confidence intervals enable us to evaluate model performance, guide decision-making processes, and ensure the robustness of our analyses in various real-world applications.