The Spider charts also known as radar or spider web charts are useful for visualizing multivariate data in the form of a two-dimensional chart with the multiple axes originating from the same point. Calculating values for the spider chart segments can be challenging especially when dealing with irregular shapes such as the bounding boxes. In this article, we'll explore two approaches to calculating spider chart values based on the bounding boxes inside chart segments.
Calculate Spider Chart Values Based on Bounding Boxes Inside Chart Segments
Below, are the methods of calculating spider chart values based on bounding boxes inside chart segments in Python:
Example 1: Calculate Spider Chart Values Using Area-based Calculation
In this example, this Python code generates a spider chart using Matplotlib, depicting the distribution of values across different categories. The spider chart values are calculated based on the provided bounding boxes. Each category is represented by a line extending from the center, and the area enclosed by each line corresponds to the value.
import matplotlib.pyplot as plt
import numpy as np


def GFG(bounding_boxes):
    """Calculate spider chart values based on bounding boxes."""
    total_area = sum(box_area(box) for box in bounding_boxes)
    spider_chart_values = [
        box_area(box) / total_area for box in bounding_boxes]
    return spider_chart_values


def box_area(box):
    """Calculate the area of a bounding box."""
    return (box[2] - box[0]) * (box[3] - box[1])


# Sample bounding boxes
bounding_boxes = [(10, 20, 50, 80), (40, 30, 70, 60), (70, 25, 110, 65)]
spider_chart_values = GFG(bounding_boxes)

# Define categories and angles for the spider chart
categories = ['Category 1', 'Category 2', 'Category 3']
num_categories = len(categories)
angles = np.linspace(0, 2 * np.pi, num_categories, endpoint=False).tolist()

# Plot spider chart
fig, ax = plt.subplots(figsize=(8, 6), subplot_kw=dict(polar=True))
ax.fill(angles, spider_chart_values, color='blue', alpha=0.25)
ax.plot(angles, spider_chart_values, color='blue',
        linewidth=2, linestyle='solid')
ax.set_yticklabels([])
ax.set_xticks(angles)
ax.set_xticklabels(categories)
ax.set_title('Spider Chart')

plt.show()
Output:
Total area of bounding boxes: 4900
Spider chart values: [0.4897959183673469, 0.1836734693877551, 0.32653061224489793]

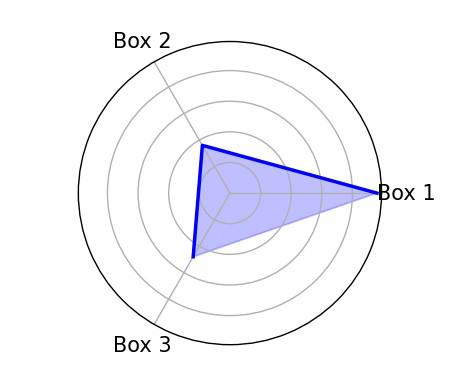
Example 2: Calculate Spider Chart Values Using Intersection-based Calculation
In this example, Python code defines functions to calculate spider chart values based on the intersection areas between given bounding boxes and a specified chart segment. It then generates a spider chart using Matplotlib, where each segment represents the intersection area of a bounding box with the chart segment also prints the calculated spider chart values and labels each segment with corresponding box names.
import matplotlib.pyplot as plt
import numpy as np


def GFG(bounding_boxes, chart_segment):
    """
    Calculate the spider chart values for given bounding boxes and chart segment.
    """
    total_segment_area = chart_segment_area(chart_segment)
    intersection_areas = [box_segment_intersection(
        box, chart_segment) for box in bounding_boxes]
    spider_chart_values = [
        area / total_segment_area for area in intersection_areas]
    return spider_chart_values


def chart_segment_area(segment):
    """
    Calculate the area of a chart segment.
    """
    return (segment[2] - segment[0]) * (segment[3] - segment[1])  # (right - left) * (bottom - top)


def box_segment_intersection(box, segment):
    """
    Calculate the intersection area between a box and a chart segment.
    """
    intersect_left = max(box[0], segment[0])
    intersect_right = min(box[2], segment[2])
    intersect_top = max(box[1], segment[1])
    intersect_bottom = min(box[3], segment[3])
    if intersect_left < intersect_right and intersect_top < intersect_bottom:
        return (intersect_right - intersect_left) * (intersect_bottom - intersect_top)
    return 0


bounding_boxes = [(10, 20, 50, 80), (40, 30, 70, 60), (70, 25, 110, 65)]
chart_segment = (0, 0, 100, 100)
spider_chart_values = GFG(bounding_boxes, chart_segment)

# Print calculation
print("Spider chart values:", spider_chart_values)

# Spider chart parameters
labels = ['Box 1', 'Box 2', 'Box 3']
angles = np.linspace(0, 2 * np.pi, len(labels), endpoint=False).tolist()
values = spider_chart_values

# Create the spider chart
fig, ax = plt.subplots(figsize=(6, 6), subplot_kw=dict(polar=True))
ax.fill(angles, values, color='blue', alpha=0.25)
ax.plot(angles, values, color='blue', linewidth=2)

# Add labels
ax.set_yticklabels([])
ax.set_xticks(angles)
ax.set_xticklabels(labels, fontsize=12)
plt.show()
Output:
Spider chart values: [0.24, 0.09, 0.12]