PyQtGraph – View Ranged Changed Event for Bar Graph
Last Updated :
30 Nov, 2021
In this article we will see how we can create a view range changed event with the bar graph in the PyQtGraph module. PyQtGraph is a graphics and user interface library for Python that provides functionality commonly required in designing and science applications. Its primary goals are to provide fast, interactive graphics for displaying data (plots, video, etc.) and second is to provide tools to aid in rapid application development (for example, property trees such as used in Qt Designer).A bar chart or bar graph is a chart or graph that presents categorical data with rectangular bars with heights or lengths proportional to the values that they represent. The bars can be plotted vertically or horizontally. A vertical bar chart is sometimes called a column chart. This event get triggered when the view ranged of the bar graph is changed. When we move the graph above the view range this event get triggered
We can create a plot window and bar graph with the help of commands given below
# creating a pyqtgraph plot window
window = pg.plot()
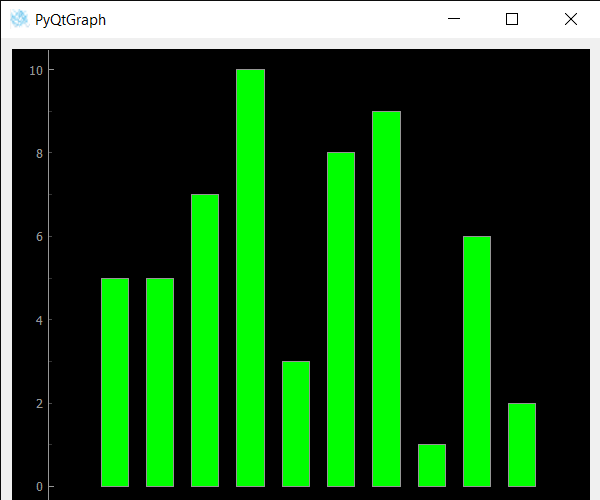
# creating a bar graph of green color
bargraph = pg.BarGraphItem(x=x, height=y1, width=0.6, brush='g')
In order to do this we have modify the bar graph class, below is the class which can be used
# Bar Graph class
class BarGraphItem(pg.BarGraphItem):

    # constructor which inherit original
    # BarGraphItem
    def __init__(self, *args, **kwargs):
        pg.BarGraphItem.__init__(self, *args, **kwargs)

    # creating view range changed event
    def viewRangeChanged(self):

        # print the message
        print("View Range Event")
Below is the implementation
Python3
# importing Qt widgets
from PyQt5.QtWidgets import * import sys

# importing pyqtgraph as pg
import pyqtgraph as pg
from PyQt5.QtGui import *

# Bar Graph class
class BarGraphItem(pg.BarGraphItem):

    # constructor which inherit original
    # BarGraphItem
    def __init__(self, *args, **kwargs):
        pg.BarGraphItem.__init__(self, *args, **kwargs)

    # creating view range changed event
    def viewRangeChanged(self):

        # print the message
        print("View Range Event")


class Window(QMainWindow):

    def __init__(self):
        super().__init__()

        # setting title
        self.setWindowTitle("PyQtGraph")

        # setting geometry
        self.setGeometry(100, 100, 600, 500)


        # icon
        icon = QIcon("skin.png")

        # setting icon to the window
        self.setWindowIcon(icon)

        # calling method
        self.UiComponents()

        # showing all the widgets
        self.show()

    # method for components
    def UiComponents(self):

        # creating a widget object
        widget = QWidget()

        # creating a plot window
        plot = pg.plot()

        # create list for y-axis
        y1 = [5, 5, 7, 10, 3, 8, 9, 1, 6, 2]

        # create horizontal list i.e x-axis
        x = [1, 2, 3, 4, 5, 6, 7, 8, 9, 10]

        # create pyqt5graph bar graph item
        # with width = 0.6
        # with bar colors = green
        bargraph = BarGraphItem(x = x, height = y1, width = 0.6, brush ='g')

        # bargraph.viewRangeChanged.connect(lambda: print("sss"))
        # add item to plot window
        # adding bargraph item to the plot window
        plot.addItem(bargraph)

        # Creating a grid layout
        layout = QGridLayout()

        # setting this layout to the widget
        widget.setLayout(layout)

        # plot window goes on right side, spanning 3 rows
        layout.addWidget(plot, 0, 1, 3, 1)

        # setting this widget as central widget of the main window
        self.setCentralWidget(widget)


# create pyqt5 app
App = QApplication(sys.argv)

# create the instance of our Window
window = Window()

# start the app
sys.exit(App.exec())
Output :
View Range Event
View Range Event
View Range Event
View Range Event
Explore
Python Fundamentals
Python Data Structures
Advanced Python
Data Science with Python
Web Development with Python
Python Practice