Z score for Outlier Detection – Python
Last Updated :
29 Feb, 2024
Z score is an important concept in statistics. Z score is also called standard score. This score helps to understand if a data value is greater or smaller than mean and how far away it is from the mean. More specifically, Z score tells how many standard deviations away a data point is from the mean.
Z score = (x -mean) / std. deviation
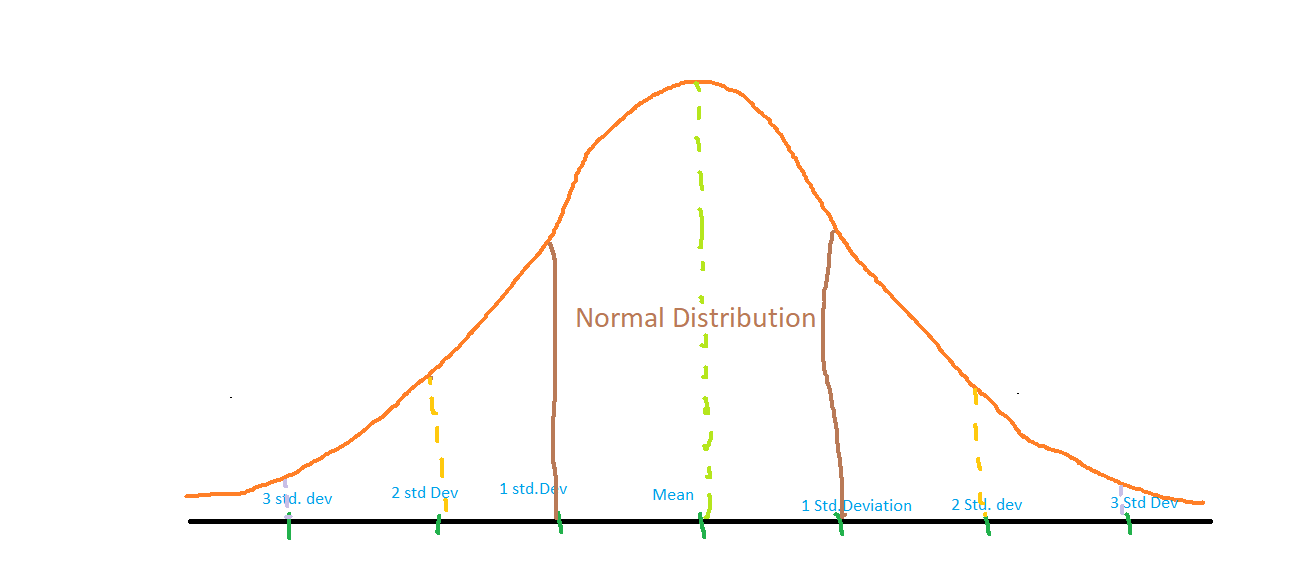
A normal distribution is shown below and it is estimated that 68% of the data points lie between +/- 1 standard deviation. 95% of the data points lie between +/- 2 standard deviation 99.7% of the data points lie between +/- 3 standard deviation
Z score and Outliers:
If the z score of a data point is more than 3, it indicates that the data point is quite different from the other data points. Such a data point can be an outlier. For example, in a survey, it was asked how many children a person had. Suppose the data obtained from people is
1, 2, 2, 2, 3, 1, 1, 15, 2, 2, 2, 3, 1, 1, 2
Clearly, 15 is an outlier in this dataset.
Let us use calculate the Z score using Python to find this outlier.
Step 1: Import necessary libraries
Step 2: Calculate mean, standard deviation
Python3
data = [1, 2, 2, 2, 3, 1, 1, 15, 2, 2, 2, 3, 1, 1, 2]
mean = np.mean(data)
std = np.std(data)
print('mean of the dataset is', mean)
print('std. deviation is', std)
|
Output:
mean of the dataset is 2.6666666666666665
std. deviation is 3.3598941782277745
Step 3: Calculate Z score. If Z score>3, print it as an outlier.
Python3
threshold = 3
outlier = []
for i in data:
z = (i-mean)/std
if z > threshold:
outlier.append(i)
print('outlier in dataset is', outlier)
|
Output:
outlier in dataset is [15]
Conclusion
: Z score helps us identify outliers in the data.
Like Article
Suggest improvement
Share your thoughts in the comments
Please Login to comment...