Working with XlsxWriter module – Python
Last Updated :
07 Feb, 2023
XlsxWriter is a Python module that provides various methods to work with Excel using Python. It can be used to read, write, applying formulas. Also, it supports features such as formatting, images, charts, page setup, auto filters, conditional formatting, and many others.
This tutorial aims at providing knowledge about the XlsxWriter module from basics to advance with the help well explained examples and concepts.
Installation
Before diving deep into the module let’s start by installing it. To install it type the below command in the terminal.
pip install XlsxWriter
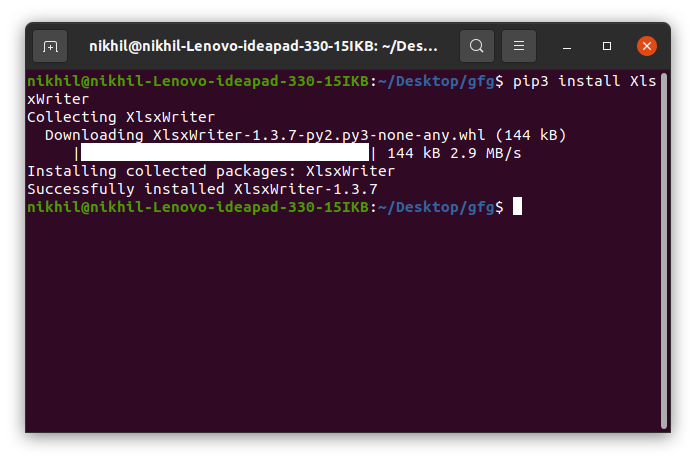
You should see the message as successfully installed. Now after the installation let’s dive deep into the module.
Creating and Writing to Excel
After the installation let’s start by writing a simple code and then we will understand the code.
Example:
Python3
import xlsxwriter
workbook = xlsxwriter.Workbook('sample.xlsx')
worksheet = workbook.add_worksheet()
worksheet.write('A1', 'Hello..')
worksheet.write('B1', 'Geeks')
worksheet.write('C1', 'For')
worksheet.write('D1', 'Geeks')
workbook.close()
|
Output:
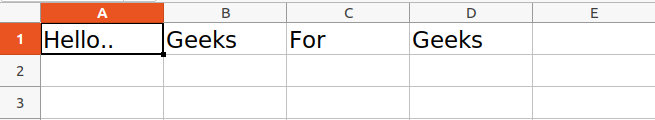
In the above example, we have called the function Workbook() which is used for creating an empty workbook. The Excel file will be created with the name of sample.xlsx. Then the add_worksheet() method is used to add a spreadsheet to the workbook and this spreadsheet is saved under the object name worksheet. Then the write() method is used to write the data to the spreadsheet. The first parameter is used to pass the cell name. The cell name can also be passed by the index name such as A1 is indexed as (0, 0), B1 is (0, 1), A2 is (1, 0), B2 is (1, 1).
Note: Rows and Columns are Zero indexed in XlsxWriter.
Now let’s see how to add data to a particular row or column. See the below example.
Example:
Python3
import xlsxwriter
workbook = xlsxwriter.Workbook('sample.xlsx')
worksheet = workbook.add_worksheet()
row = 0
column = 0
content = ["Welcome", "to", "Geeks", "for", "Geeks"]
for item in content :
worksheet.write(row, column, item)
row += 1
workbook.close()
|
Output:
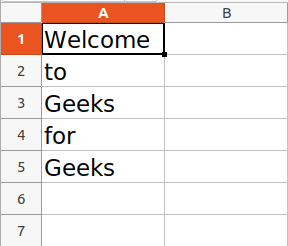
You might have seen that we are playing with the index number to write in a particular row. Similarly, we can use a similar way to write to a particular column.
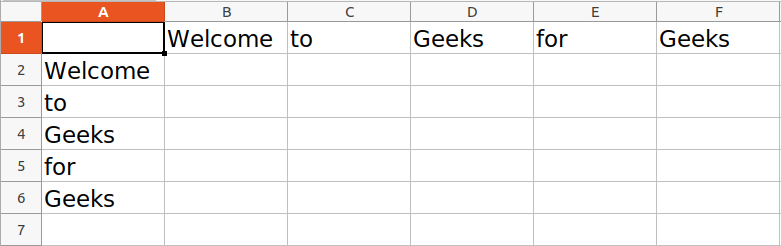
The XlsxWriter module also provides the write_row() and write_column() methods to write in a particular row or column.
Example:
Python3
import xlsxwriter
workbook = xlsxwriter.Workbook('sample.xlsx')
worksheet = workbook.add_worksheet()
content = ["Welcome", "to", "Geeks", "for", "Geeks"]
worksheet.write_row(0, 1, content)
worksheet.write_column(1, 0, content)
workbook.close()
|
Output:
Refer to the below article to get detailed information about writing to Excel using the XlsxWriter module.
Working with Formulas
XlsxWriter module provides the write_formula() and write_array_formula() methods to directly write the formulas in Excel.
- write_formula() method is used to directly write the formula to a worksheet cell
- write_array_formula() method is used to write an array formula to a worksheet cell. Array formula in Excel is that formula that performs on a set of values.
Syntax:
write_formula(row, col, formula[, cell_format[, value]])
write_array_formula(first_row, first_col, last_row, last_col, formula[, cell_format[, value]])
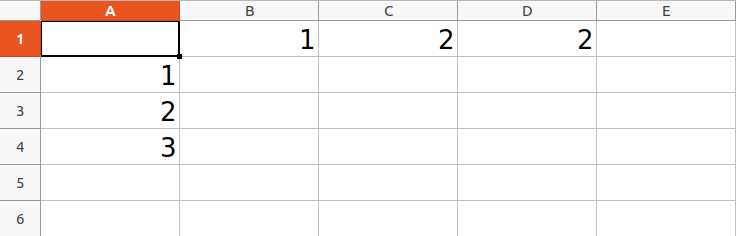
Example 1: Using the write_formula() method
Python3
import xlsxwriter
workbook = xlsxwriter.Workbook('sample.xlsx')
worksheet = workbook.add_worksheet()
content = [1, 2]
worksheet.write_row(0, 1, content)
worksheet.write_column(1, 0, content)
worksheet.write_formula('A4', '{=SUM(A2, A3)}')
worksheet.write_formula('D1', '{=PRODUCT(B1, C1)}')
workbook.close()
|
Output:
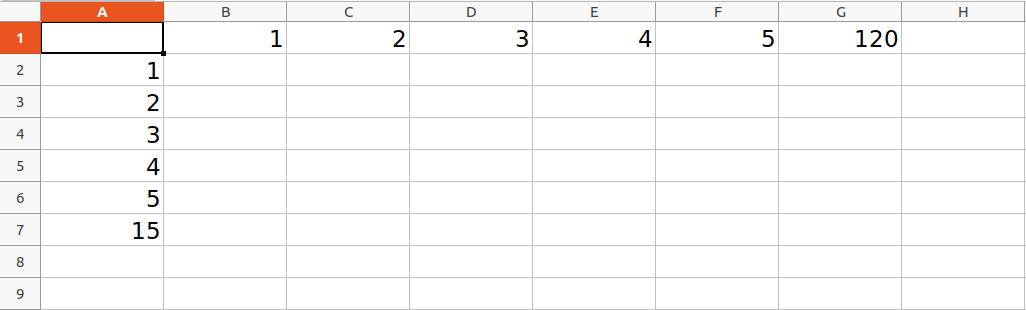
Example 2: Using the write_array_formula() method
Python3
import xlsxwriter
workbook = xlsxwriter.Workbook('sample.xlsx')
worksheet = workbook.add_worksheet()
content = [1, 2, 3, 4, 5]
worksheet.write_row(0, 1, content)
worksheet.write_column(1, 0, content)
worksheet.write_array_formula('A7', '{=SUM(A1:A6)}')
worksheet.write_array_formula('G1', '{=PRODUCT(B1:F1)}')
workbook.close()
|
Output:
Adding Charts
XlsxWriter provides a class Chart that acts as a base class for implementing charts. The chart object is created using the add_chart() method. This method also specifies the type of the chart. After creating the chart, the chart is added to the specified cell using the insert_chart() method or it can be set using the set_chart() method.
Syntax:
add_chart(options)
insert_chart(row, col, chart[, options])
set_chart(chart)
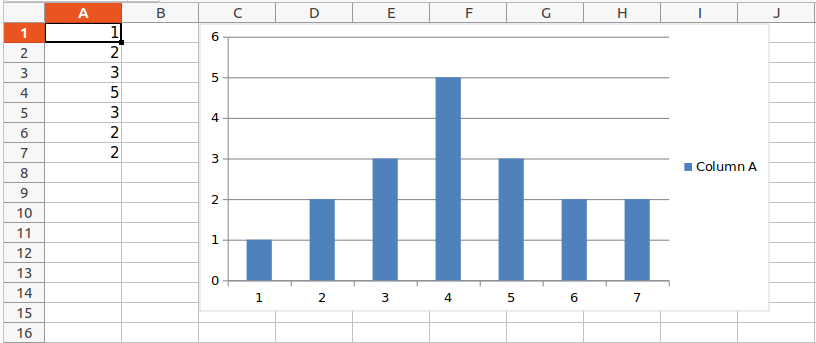
Example 1:
Python3
import xlsxwriter
workbook = xlsxwriter.Workbook('sample.xlsx')
worksheet = workbook.add_worksheet()
content = [1, 2, 3, 5, 3, 2, 2]
worksheet.write_column(0, 0, content)
chart = workbook.add_chart({'type': 'column'})
chart.add_series({'values': '=Sheet1!$A$1:$A$7'})
worksheet.insert_chart('C1', chart)
workbook.close()
|
Output:
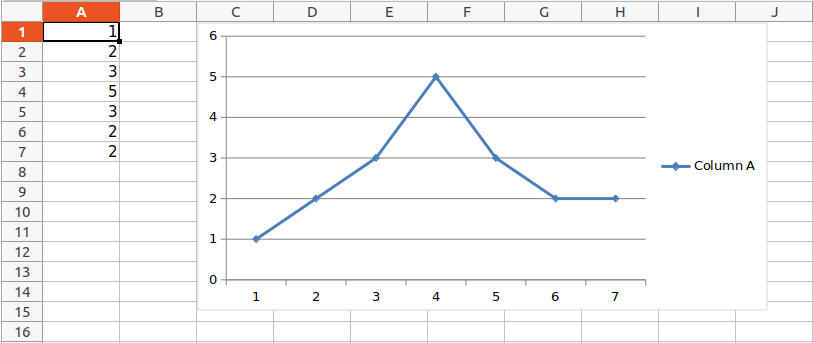
Example 2: Adding the line chart with diamond points
Python3
import xlsxwriter
workbook = xlsxwriter.Workbook('sample.xlsx')
worksheet = workbook.add_worksheet()
content = [1, 2, 3, 5, 3, 2, 2]
worksheet.write_column(0, 0, content)
chart = workbook.add_chart({'type': 'line'})
chart.add_series({'values': '=Sheet1!$A$1:$A$7',
'marker': {'type': 'diamond'},})
worksheet.insert_chart('C1', chart)
workbook.close()
|
Output:
Refer to the below articles to get a detailed information about plotting charts using XlsxWriter module.
Adding Tables
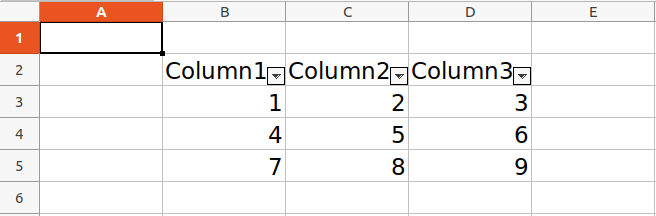
Tables can be added using the add_table() method. The data parameter of the table is used to specify the data for the cells of the table.. The header_row parameter is used to turn off or on the header row to the table.
Syntax:
add_table(first_row, first_col, last_row, last_col, options)
Example:
Python3
import xlsxwriter
workbook = xlsxwriter.Workbook('sample.xlsx')
worksheet = workbook.add_worksheet()
data = [
[1, 2, 3],
[4, 5, 6],
[7, 8, 9],
[10, 11, 12],
]
worksheet.add_table('B2:D5', {'data': data})
workbook.close()
|
Output:
Working with Pandas and XlsxWriter
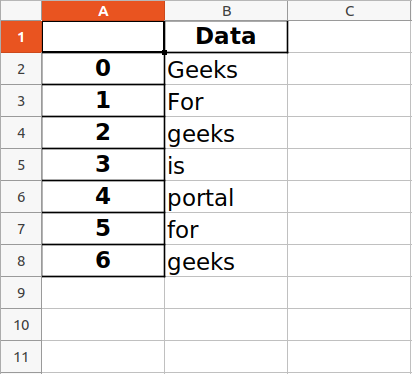
Pandas write Excel files using the XlsxWriter or Openpyxl module. This can be used to read, filter, and re-arrange either small or large datasets and output them in a range of formats including Excel. The ExcelWriter() method of the pandas library creates a Excel writer object using XlsxWriter. Then the to_excel() method is used to write the dataframe to the excel.
Example 1:
Python3
import pandas as pd
df = pd.DataFrame({'Data': ['Geeks', 'For', 'geeks', 'is',
'portal', 'for', 'geeks']})
writer = pd.ExcelWriter('sample.xlsx',
engine='xlsxwriter')
df.to_excel(writer, sheet_name='Sheet1')
writer.save()
|
Output:
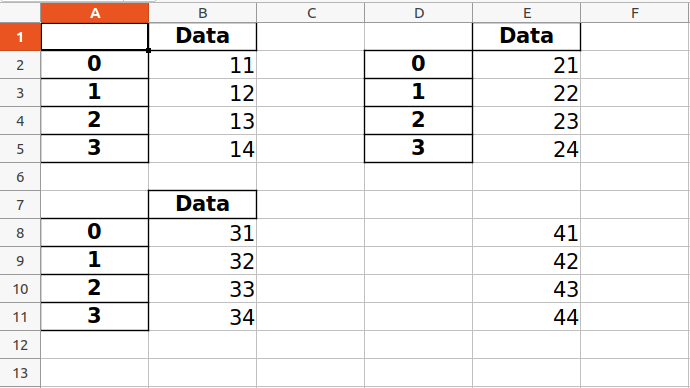
Example 2: Writing to multiple dataframes.
Python3
import pandas as pd
df1 = pd.DataFrame({'Data': [11, 12, 13, 14]})
df2 = pd.DataFrame({'Data': [21, 22, 23, 24]})
df3 = pd.DataFrame({'Data': [31, 32, 33, 34]})
df4 = pd.DataFrame({'Data': [41, 42, 43, 44]})
writer = pd.ExcelWriter('sample.xlsx',
engine='xlsxwriter')
df1.to_excel(writer, sheet_name='Sheet1')
df2.to_excel(writer, sheet_name='Sheet1', startcol=3)
df3.to_excel(writer, sheet_name='Sheet1', startrow=6)
df4.to_excel(writer, sheet_name='Sheet1',
startrow=7, startcol=4,
header=False, index=False)
writer.save()
|
Output:
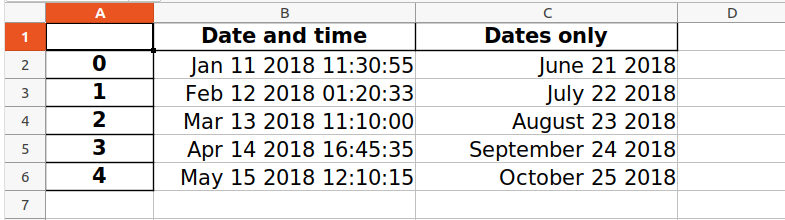
Example 3: Converting a Pandas dataframe with datetimes to an Excel file with a default datetime and date format using Pandas and XlsxWriter.
Python3
import pandas as pd
from datetime import datetime, date
dataframe = pd.DataFrame({
'Date and time': [datetime(2018, 1, 11, 11, 30, 55),
datetime(2018, 2, 12, 1, 20, 33),
datetime(2018, 3, 13, 11, 10),
datetime(2018, 4, 14, 16, 45, 35),
datetime(2018, 5, 15, 12, 10, 15)],
'Dates only': [date(2018, 6, 21),
date(2018, 7, 22),
date(2018, 8, 23),
date(2018, 9, 24),
date(2018, 10, 25)], })
writer_object = pd.ExcelWriter("sample.xlsx",
engine='xlsxwriter',
datetime_format='mmm d yyyy hh:mm:ss',
date_format='mmmm dd yyyy')
dataframe.to_excel(writer_object, sheet_name='Sheet1')
worksheet_object = writer_object.sheets['Sheet1']
worksheet_object.set_column('B:C', 20)
writer_object.save()
|
Output:
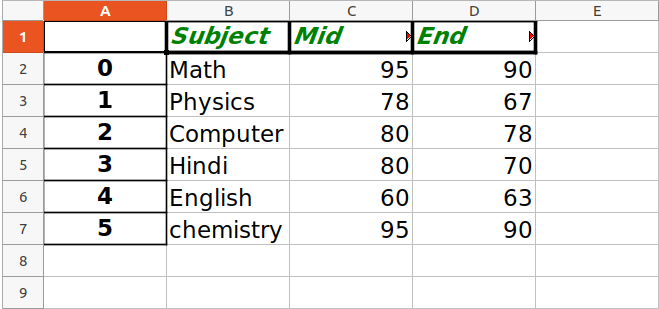
Example 4: Converting a Pandas dataframe to an Excel file with a user defined header format using Pandas and XlsxWriter.
Python3
import pandas as pd
data1 = ["Math", "Physics", "Computer",
"Hindi", "English", "chemistry"]
data2 = [95, 78, 80, 80, 60, 95]
data3 = [90, 67, 78, 70, 63, 90]
dataframe = pd.DataFrame(
{'Subject': data1,
'Mid Term Exam Scores Out of 100': data2,
'End Term Exam Scores Out of 100': data3})
writer_object = pd.ExcelWriter("sample.xlsx",
engine='xlsxwriter')
dataframe.to_excel(writer_object, sheet_name='Sheet1',
startrow=1, header=False)
workbook_object = writer_object.book
worksheet_object = writer_object.sheets['Sheet1']
header_format_object = workbook_object.add_format({
'bold': True,
'italic': True,
'text_wrap': True,
'valign': 'top',
'font_color': 'green',
'border': 2})
for col_number, value in enumerate(dataframe.columns.values):
worksheet_object.write(0, col_number + 1, value,
header_format_object)
writer_object.save()
|
Output:
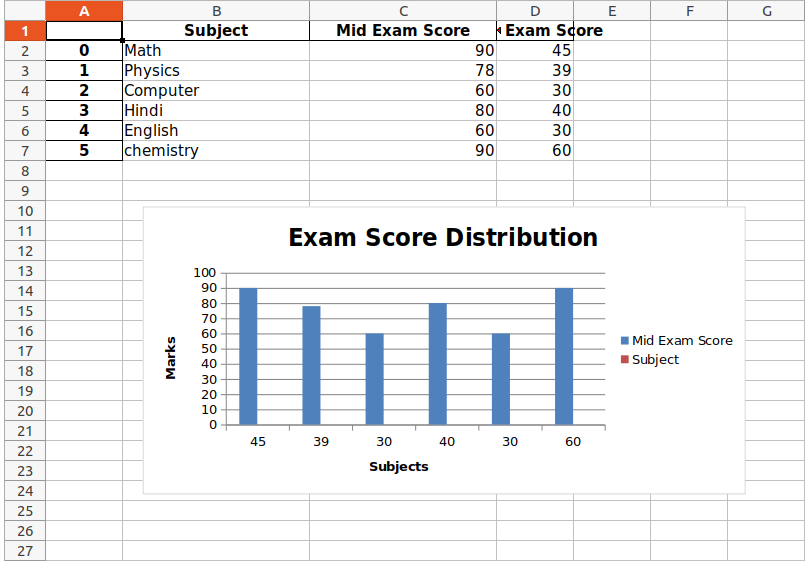
Creating Charts using Pandas and XlsxWriter
Till now we have seen different methods for adding the data to the Excel files using the Pandas and the XlsxWriter module. Now after the data is inserted we can simply create the charts using the add_chart() method as we have seen above.
Example:
Python3
import pandas as pd
dataframe = pd.DataFrame({
'Subject': ["Math", "Physics", "Computer",
"Hindi", "English", "chemistry"],
'Mid Exam Score': [90, 78, 60, 80, 60, 90],
'End Exam Score': [45, 39, 30, 40, 30, 60]})
writer_object = pd.ExcelWriter('sample.xlsx',
engine='xlsxwriter')
dataframe.to_excel(writer_object, sheet_name='Sheet1')
workbook_object = writer_object.book
worksheet_object = writer_object.sheets['Sheet1']
worksheet_object.set_column('B:C', 20)
chart_object = workbook_object.add_chart({'type': 'column'})
chart_object.add_series({
'name': ['Sheet1', 0, 2],
'categories': ['Sheet1', 1, 3, 6, 3],
'values': ['Sheet1', 1, 2, 6, 2],
})
chart_object.add_series({
'name': ['Sheet1', 0, 1],
'categories': ['Sheet1', 1, 3, 6, 3],
'values': ['Sheet1', 1, 1, 6, 1],
})
chart_object.set_title({'name': 'Exam Score Distribution'})
chart_object.set_x_axis({'name': 'Subjects'})
chart_object.set_y_axis({'name': 'Marks'})
worksheet_object.insert_chart('B10', chart_object,
{'x_offset': 20, 'y_offset': 5})
writer_object.save()
|
Output:
Refer to the below articles to get detailed information about working with Xlsxwriter and Pandas.
Like Article
Suggest improvement
Share your thoughts in the comments
Please Login to comment...