Working with Legends in R using ggplot2
Last Updated :
28 Jul, 2021
A legend in a plot helps us to understand which groups belong to each bar, line, or box based on its type, color, etc. We can add a legend box in R using the legend() function. These work as guides. The keys can be determined by scale breaks. In this article, we will be working with legends and associated customization using ggplot2 in R programming language.
Syntax :
legend(x, y = NULL, legend, fill = NULL, col = par(“col”), border = “black”, lty, lwd, pch)
Installation
We will first install and load the ggplot2 package since, without this package, we would not be able to plot our data. So, we can install the package using the below command.
install.packages("ggplot2")
Load the package using the library function in the R programming language.
We will try to plot different aspects of the data using the ggplot() function. For a plot dealing with data that can be compared with one another, an appropriate legend will be generated by default for reference.
Example: R program to show default legend
R
library(ggplot2)
data("USArrests")
head(USArrests)
plt <- ggplot(USArrests, aes(Murder, Assault, colour = UrbanPop)) +
geom_point()
plt
|
Output :
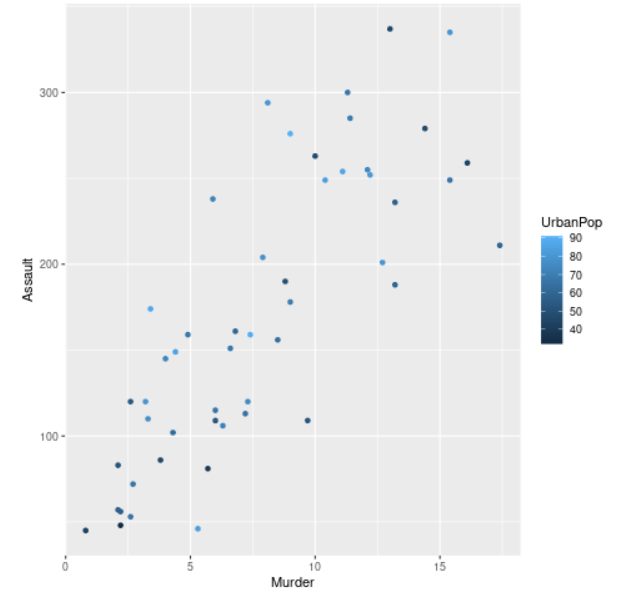
The legend so generated can be easily customized as per requirements.
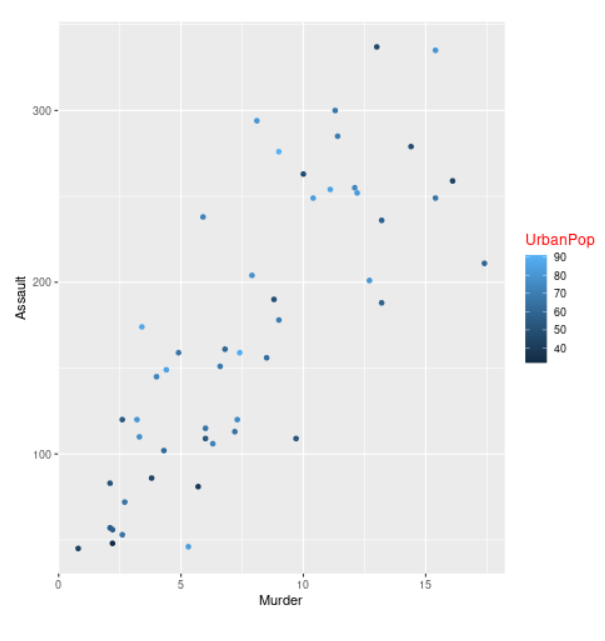
Changing the color and size of the title of the legend
Here, we will change the color and size of the title of the legend formed from the plot. This can be done using the theme() function. We will pass the legend.title argument inside this function. The legend.title argument basically refers to the title of the legend formed. The legend.title argument is equal to the element_text function which is inherited from the title and accepts arguments like color, size, etc.
Syntax :
theme( legend.title = element_text(), …., complete = FALSE, validate = TRUE)
Example: R program to customize legend title
R
library(ggplot2)
data("USArrests")
plt <- ggplot(USArrests, aes(Murder, Assault, colour = UrbanPop)) +
geom_point()
plt + theme(legend.title = element_text(colour = "red", size = 12))
|
Output :
Changing the color and size of the labels
Here, we will change the color and size of the labels of the legend formed. This can be done using the theme() function by passing legend.text as the argument. The legend.text is equal to element_text() function which is inherited from text and accepts arguments like color, size, font, etc. The legend.text argument basically refers to labels of legend items.
Syntax :
theme( legend.text = element_text(), … , complete = FALSE, validate = TRUE)
Example: R program to customize legend labels
R
library(ggplot2)
data("USArrests")
head(USArrests)
plt <- ggplot(USArrests, aes(Murder, Assault, colour = UrbanPop)) +
geom_point()
plt + theme(legend.text = element_text(colour = "blue", size = 9))
plt
|
Output :
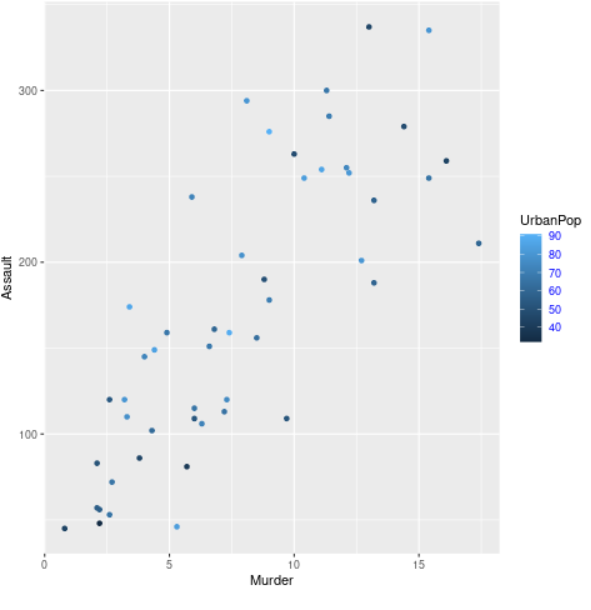
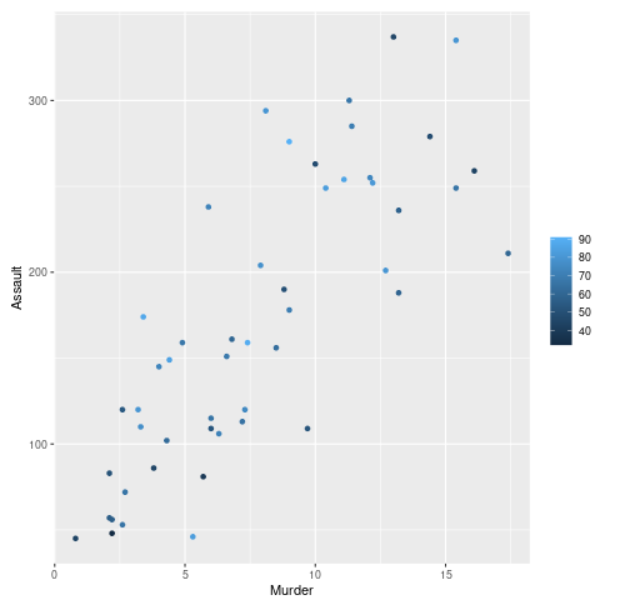
Hiding legend title
We will hide the legend title here using the theme() function providing legend.title as an argument. Here, the legend.title is equal to element_blank() function. The element_blank() assigns no space and also draws nothing.
Syntax :
theme( legend.title = element_blank(),…., complete = FALSE, validate = TRUE)
Example: R program to hide legend title
R
library(ggplot2)
data("USArrests")
plt <- ggplot(USArrests, aes(Murder, Assault, colour = UrbanPop)) +
geom_point()
plt + theme(legend.title = element_blank())
|
Output :
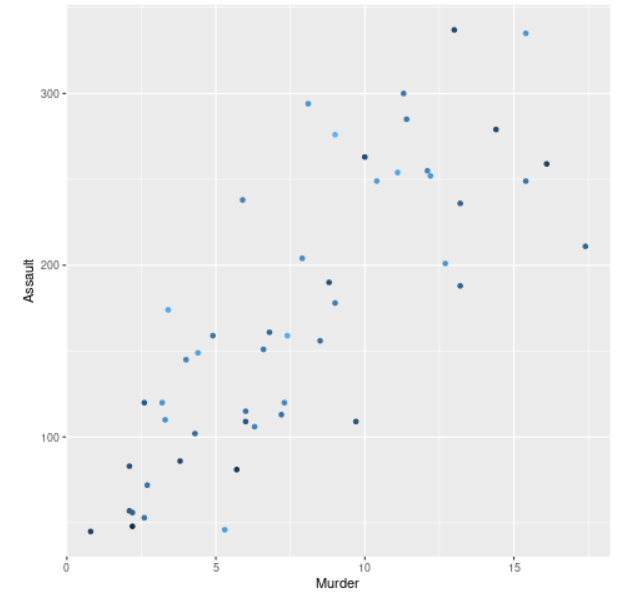
Removing legend
We can remove the legend by providing “none” in legend.position as an argument of theme() function. The legend.position argument refers to the position of the legends.
Syntax :
theme( legend.position = “none”, … , complete = FALSE, validate = TRUE)
Example: R program to remove legends
R
library(ggplot2)
data("USArrests")
plt <- ggplot(USArrests, aes(Murder, Assault, colour = UrbanPop))+
geom_point()
plt + theme(legend.position = "none")
|
Output :
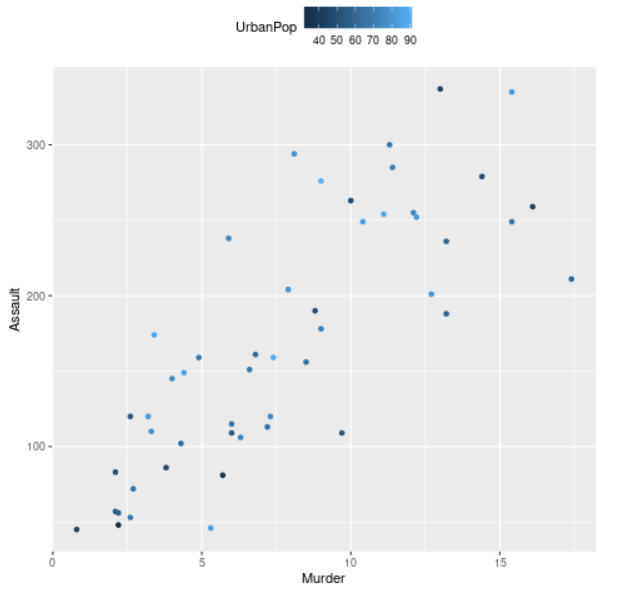
Placing the legend position at the top
Here, we will change the position of the legend from side to top. We will do this using the theme() function and providing legend.position as an argument. The legend.position argument will be assigned as a top.
Syntax :
theme( legend.position = “top”, …, complete = FALSE, validate = TRUE)
Example : R program to place the legend at the top
R
library(ggplot2)
data("USArrests")
plt <- ggplot(USArrests, aes(Murder, Assault, colour = UrbanPop)) +
geom_point()
plt + theme(legend.position = "top")
|
Output :
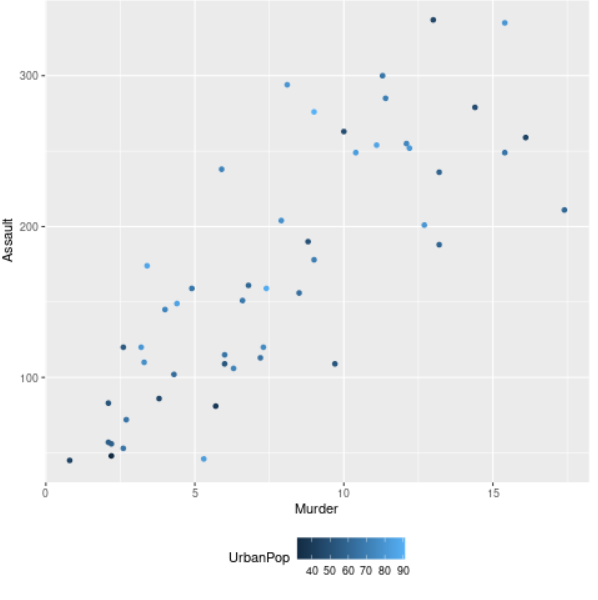
Placing the legend position at the bottom
Here, we will change the position of the legend and place it at the bottom. We will be using the theme() function and we will pass the legend.position argument. The legend.position argument will be assigned with the bottom.
Syntax :
theme( legend.position = “bottom”, …, complete = FALSE, validate = TRUE)
Example: R program to place the legend at the bottom
R
library(ggplot2)
data("USArrests")
plt <- ggplot(USArrests, aes(Murder, Assault, colour = UrbanPop)) +
geom_point()
plt + theme(legend.position = "bottom")
|
Output :
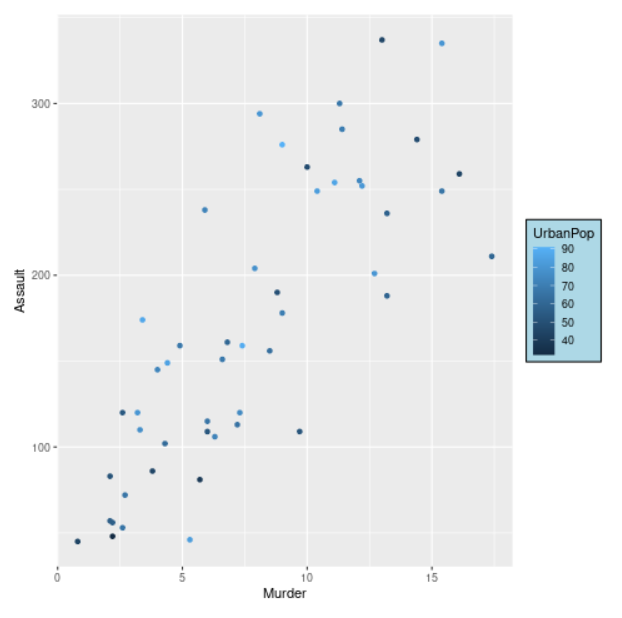
Drawing a box around legend and adding a background color to it
We will add a box around our legend and add color to it using the theme() function and providing legend.background as the argument. The legend.background is equal to element_rect() function, where this function creates a rectangular box around our legend, and we can use the fill argument to add background color to it.
Syntax :
theme( legend.box.background = element_rect(), …., complete = FALSE, validate = TRUE)
Example: R program to draw a box around a legend and add a background color to it
R
library(ggplot2)
data("USArrests")
head(USArrests)
plt <- ggplot(USArrests, aes(Murder, Assault, colour = UrbanPop)) +
geom_point()
plt + theme( legend.background = element_rect( fill = "lightblue",
size = 0.5, linetype = "solid", colour = "black"))
|
Output :
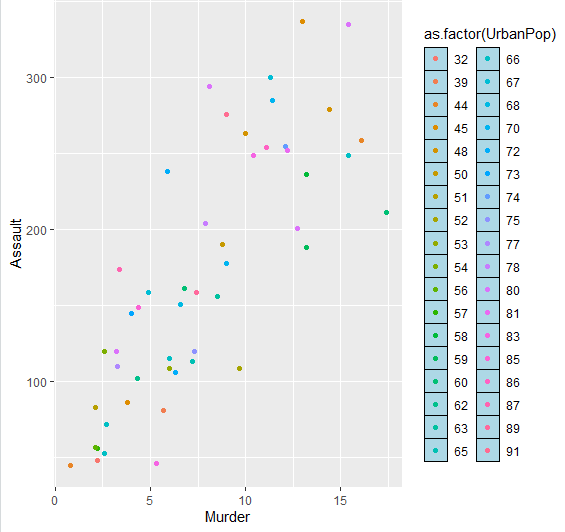
Changing key style and changing legend color
We can change the key style of the legend and legend color using the theme function and providing legend.key as an argument. The legend.key argument is equal to the element_rect function which contains “color” for the outline color of the legend keys and “fill” for the inside color of the keys as its arguments. The as.factor() function will be used for the color argument to convert a vector or column from numeric to factor.
Example: R program change key style and legend color
R
library(ggplot2)
data("USArrests")
head(USArrests)
plt <- ggplot(USArrests, aes(Murder, Assault, colour =
as.factor(UrbanPop))) + geom_point()+
theme(legend.key = element_rect( color = "black",
fill = "light blue"))
plt
|
Output :
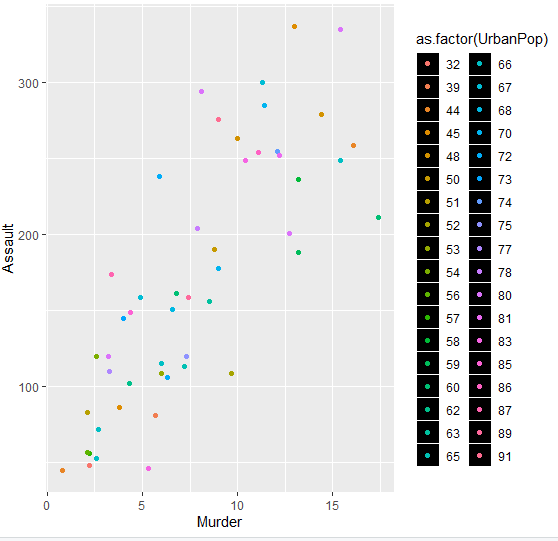
Example 2: R program change key style and legend color
R
library(ggplot2)
data("USArrests")
head(USArrests)
plt <- ggplot(USArrests, aes(Murder, Assault, colour = as.factor(UrbanPop))) +
geom_point()+ theme(legend.key = element_rect( color = "white", fill = "black"))
plt
|
Output :
Like Article
Suggest improvement
Share your thoughts in the comments
Please Login to comment...