Working with Excel files using Pandas
Last Updated :
14 Dec, 2023
Excel sheets are very instinctive and user-friendly, which makes them ideal for manipulating large datasets even for less technical folks. If you are looking for places to learn to manipulate and automate stuff in Excel files using Python, look no further. You are at the right place.
In this article, you will learn how to use Pandas to work with Excel spreadsheets. In this article we will learn about:
- Read Excel File using Pandas in Python
- Installing and Importing Pandas
- Reading multiple Excel sheets using Pandas
- Application of different Pandas functions
Reading Excel File using Pandas in Python
Installating Pandas
To install Pandas in Python, we can use the following command in the command prompt:
pip install pandas
To install Pandas in Anaconda, we can use the following command in Anaconda Terminal:
conda install pandas
Importing Pandas
First of all, we need to import the Pandas module which can be done by running the command:
Input File: Let’s suppose the Excel file looks like this
Sheet 1:
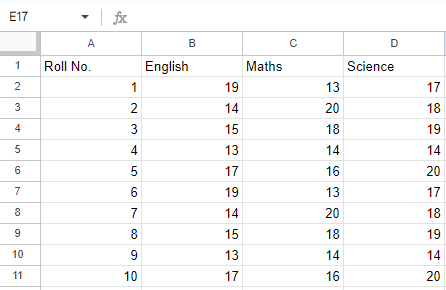
Sheet 1
Sheet 2:
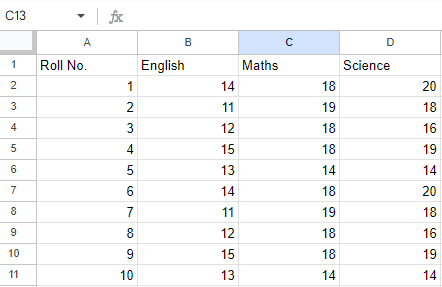
Sheet 2
Now we can import the Excel file using the read_excel function in Pandas to read Excel file using Pandas in Python. The second statement reads the data from Excel and stores it into a pandas Data Frame which is represented by the variable newData.
Python3
df = pd.read_excel('Example.xlsx')
print(df)
|
Output:
   Roll No.  English  Maths  Science
0         1       19     13       17
1         2       14     20       18
2         3       15     18       19
3         4       13     14       14
4         5       17     16       20
5         6       19     13       17
6         7       14     20       18
7         8       15     18       19
8         9       13     14       14
9        10       17     16       20
Loading multiple sheets using Concat() method
If there are multiple sheets in the Excel workbook, the command will import data from the first sheet. To make a data frame with all the sheets in the workbook, the easiest method is to create different data frames separately and then concatenate them. The read_excel method takes argument sheet_name and index_col where we can specify the sheet of which the frame should be made of and index_col specifies the title column, as is shown below:
Example:
The third statement concatenates both sheets. Now to check the whole data frame, we can simply run the following command:
Python3
file = 'Example.xlsx'
sheet1 = pd.read_excel(file,
sheet_name = 0,
index_col = 0)
sheet2 = pd.read_excel(file,
sheet_name = 1,
index_col = 0)
newData = pd.concat([sheet1, sheet2])
print(newData)
|
Output:
Roll No.    English  Maths  Science
1              19     13        17
2              14     20      18
3              15     18       19
4              13     14       14
5              17     16       20
6              19     13       17
7              14     20      18
8              15     18       19
9              13     14       14
10             17     16       20
1              14     18       20
2              11     19        18
3              12     18       16
4              15     18       19
5              13     14       14
6              14     18       20
7              11     19       18
8              12     18       16
9              15     18       19
10             13     14       14
Head() and Tail() methods in Pandas
To view 5 columns from the top and from the bottom of the data frame, we can run the command. This head() and tail() method also take arguments as numbers for the number of columns to show.
Python3
print(newData.head())
print(newData.tail())
|
Output:
          English  Maths  Science
Roll No.
1              19     13       17
2              14     20       18
3              15     18       19
4              13     14       14
5              17     16       20
          English  Maths  Science
Roll No.
6              14     18       20
7              11     19       18
8              12     18       16
9              15     18       19
10             13     14       14
Shape() method
The shape() method can be used to view the number of rows and columns in the data frame as follows:
Output:
(20, 3)
Sort_values() method in Pandas
If any column contains numerical data, we can sort that column using the sort_values() method in pandas as follows:
Python3
sorted_column = newData.sort_values(['English'], ascending = False)
|
Now, let’s suppose we want the top 5 values of the sorted column, we can use the head() method here:
Output:
          English  Maths  Science
Roll No.
1              19     13       17
6              19     13       17
5              17     16       20
10             17     16       20
3              15     18       19
We can do that with any numerical column of the data frame as shown below:
Output:
Roll No.
1    13
2    20
3    18
4    14
5    16
Name: Maths, dtype: int64
Pandas Describe() method
Now, suppose our data is mostly numerical. We can get the statistical information like mean, max, min, etc. about the data frame using the describe() method as shown below:
Output:
        English      Maths    Science
count  20.00000  20.000000  20.000000
mean   14.30000  16.800000  17.500000
std     2.29645   2.330575   2.164304
min    11.00000  13.000000  14.000000
25%    13.00000  14.000000  16.000000
50%    14.00000  18.000000  18.000000
75%    15.00000  18.000000  19.000000
max    19.00000  20.000000  20.000000
This can also be done separately for all the numerical columns using the following command:
Python3
newData['English'].mean()
|
Output:
14.3
Other statistical information can also be calculated using the respective methods. Like in Excel, formulas can also be applied, and calculated columns can be created as follows:
Python3
newData['Total Marks'] =
newData["English"] + newData["Maths"] + newData["Science"]
newData['Total Marks'].head()
|
Output:
Roll No.
1    49
2    52
3    52
4    41
5    53
Name: Total Marks, dtype: int64
After operating on the data in the data frame, we can export the data back to an Excel file using the method to_excel. For this, we need to specify an output Excel file where the transformed data is to be written, as shown below:
Python3
newData.to_excel('Output File.xlsx')
|
Output:
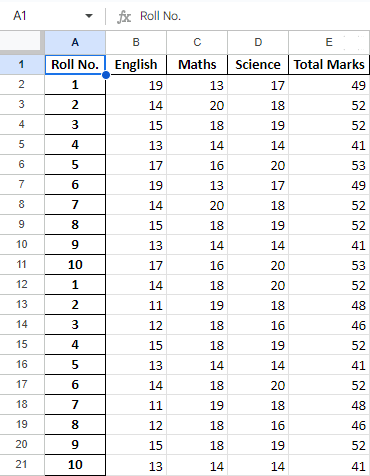
Final Sheet
Like Article
Suggest improvement
Share your thoughts in the comments
Please Login to comment...