In statistical data, the descriptive summary of a data set is known as the central tendency. It is considered to be an indicator of the center of the data distribution. To summarise, it represents the single value of the entire distribution or a dataset. It describes the data precisely.
However, the central tendency of the data distribution does not provide information regarding individual data from the dataset. There are various measures of the central tendency of the data.
Measures of Central Tendency
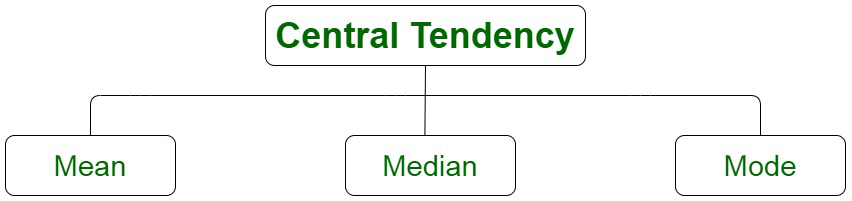
Since we described, the central tendency of the data as an indicator of the values, describing the dataset by computing the central position of the data. The central tendency of the data can be measured by the following quantities :
- Mean: Mean is considered to be the sum of all observations divided by the total number of observations.
- Median: Median is defined as the middle or central value in an ordered set.
- Mode: Mode is defined as the most frequently occurring value in a data set.
Ogive
The Ogive of particular data distribution is defined as the frequency distribution graph of a series. The Ogive for any cumulative distribution can be constructed as a graph explaining the data values on the horizontal plane axis. It may even portray the cumulative frequencies or relative frequencies, or even cumulative percent frequencies on the vertical axis.
For instance, the popularity of given data distribution within a certain frequency range can be easily plotted with the Ogive curve which helps in finding those details very accurately. It is, therefore, used to make an accurate precision about the likelihood of the data.
The Ogive is constructed by plotting the point corresponding to the cumulative frequency of each class interval. It is depicted in the pictorial form. It basically provides an estimation of the number of observations that are less than equal to a given specified value.
Types of Ogive
Ogive is defined as the total frequencies which are displayed in the form of a table distributed in class intervals. There are basically two different types of ogive i.e. lesser than and greater than.
Lesser Than Ogive
In the lesser than ogive, a plot is obtained and depicted by adding successively the frequencies belonging to all the previous classes. It also includes the class to which it belongs. This type of ogive has the number of observations lesser than the boundary of the upper class. We begin the cumulate from the lowest reaching up to the highest size.
Greater Than Ogive
Also known as more than type ogive, this type of ogive has the number of observations more than or equal to the lesser boundary of the class. This type of ogive is the reverse of lesser than ogive. It can be obtained by computing the cumulative total of frequencies which begins at the highest reaching the lowest class.
Constructing an Ogive Chart
A simple visual way of depicting and plotting the cumulative frequencies belonging to different values or categories is part of constructing an ogive chart. There are various steps involved in the construction of an ogive chart:
- A frequency distribution table of a suitable class length is computed using the continuous variables.
- The frequency for each class interval is computed.
- The endpoint for each class interval is computed. (upper limit or lower limit).
- The numbers are added in the frequency column to compute the cumulative frequency of the data distribution.
- Store the results in a tabular format.
Uses of Ogive Curve
Ogive Graph or the cumulative frequency graphs are used to find the median of the given set of data. If both, less than and greater than, cumulative frequency curve is drawn on the same graph, we can easily find the median value. The point in which, both the curve intersects, corresponding to the x-axis, gives the median value. Apart from finding the medians, Ogives are used in computing the percentiles of the data set values.
Median
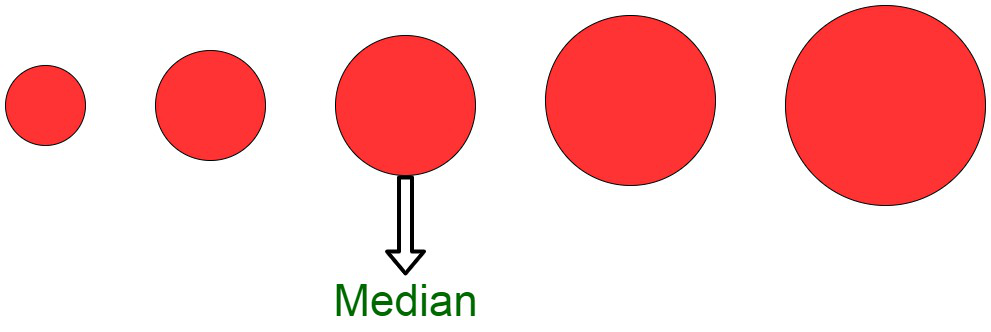
The median of a dataset or data distribution is defined as the middlemost number or a center value in the set. The median is the mean in the ascending order sorted data. The Median is the computed average in sorted data. Median gives a measure of the central tendency of the data in case the data is already available in the ascending order. It can be considered to be an indicator of the center of the data distribution.
However, the median of the data gives a slight estimate about the arrangement of the data, which means that the values to the left of the median are smaller than it and similarly, the values to the right of the media are larger than the median. The median of the data set may not be unique.
In order to compute the median of given data distribution, the data set is first sorted into an ascending order manually. The data now is arranged in the values beginning from the lowest to the highest values. A median can be considered to be a number that is separated by the higher half of a data sample, from the lower half. The median varies for different types of data distribution. For an odd number of observations, the median of the data is the middle value of the sorted data. For a data set with an even number of observations, the median is the average of the middle two values.
For instance, the median of the given data values, 3, 3, 5, 9, 11 is 5. Since, there are an even number of observations, the median is equivalent to the mean or average of the two middle values, therefore , the median of 3, 5, 7, 9 is (5+7)/2 = 6.
To find the median on ogive, follow these steps:
- All the points are plotted and then correspondingly joined with lines.
- The value of
 is computed.
 - The value is marked in the Cumulative frequency scale (y-axis).
- This value is joined to the line formed by plotting the points with dotted lines .
- Connect this point to the x axis point using a straight dotted line.
- The point of intersection is the median.
Sample Questions
Question 1. Compute the median of the following data:
2, 5, 7, 3, 11, 9, 12, 4, 1, 15 , 2.
Solution:
In order to find the median of the data, we have,
Arranging the data in ascending order
1, 2, 2, 3, 4, 5, 7, 9, 11, 12, 15
There are total 11 numbers in the data distribution.
The median is the 6th number.
Therefore, the median is 5.
The median value of this set of numbers is 24.
Question 2. How is median of two numbers computed?
Solution:
Since, we have an even number of observations, we have,
i.e. Median = ![\left[\frac{(\frac{n}{2})^{th} term + (\frac{n}{2})^{+1^{th}} term}{2} \right]](https://www.geeksforgeeks.org/wp-content/ql-cache/quicklatex.com-6ccca8b2dec1a66b2a4327c9dad6c8a1_l3.png "Rendered by QuickLaTeX.com")
For example: In order to compute the median of the numbers 12 and 17 is: ![\frac{[(12)+(17)]}{2} = \frac{29}{2} = 14.5](https://www.geeksforgeeks.org/wp-content/ql-cache/quicklatex.com-5d8eb81be38dda865ab2782b3e4d0693_l3.png "Rendered by QuickLaTeX.com")
Question 3. Differentiate between Mean and Median?
Solution:
Mean
| Median
|
| The average arithmetic of a given set of numbers | The method of separating the higher sample with the lower value from a probability distribution |
| Used for normal distributions | Used for skewed distributions. |
| There are a lot of external factors that limit the use of Mean. | It is much more robust and reliable for measuring the data for uneven data. |
| calculated by adding all the values and dividing the total by the number of values. | computed by listing all the numbers available in the set in arranging the order and then finding the number in the centre of the distribution. |
| arithmetic average. | positional average. |
| It is highly sensitive to outlier data | It is not much sensitive to the outlier data. |
Question 4. Illustrate the 4 measures of central tendency?
Solution:
The four measures of central tendency are mean, median, mode, and midrange. Here, mid-range or mid-extreme of a set of statistical data values is the arithmetic mean of the maximum and minimum values in a data set.
Question 5. How do you find the central tendency?
Solution:
The central tendency can be computed using the mean, median (middlemost value), or mode(most occurring value) in the data set.
Like Article
Suggest improvement
Share your thoughts in the comments
Please Login to comment...