What is Upsampling in MATLAB?
Last Updated :
06 Mar, 2023
In this article, we will see Upsampling in MATLAB. As we know that upsampling is the process of increasing the sampling rate, i.e, increasing the number of samples. When an upsampling functions on a series of samples of a signal or other continued function, it has an estimation of the row that would have been received by sampling the signal at a higher rate. Upsampling is the method of putting zero-valued samples between actual samples to increase the sampling rate. The number of zeros between the samples is decided by the sampling factor L, (Number of zeros = L-1).
In digital signal processing, signals are usually represented as a sequence of samples, where each sample is a numerical value representing the amplitude of the signal at a particular point in time. When a signal is upsampled, the number of samples in the signal is increased, resulting in a higher sample rate. This can be useful in a variety of applications, such as digital audio processing, image processing, and telecommunications.
The process of upsampling involves inserting zeros between each pair of consecutive samples in the signal. This increases the spacing between the samples and effectively increases the sample rate of the signal. The new samples created by the upsampling process are usually filled with zeros, although other interpolation methods can be used to fill the gaps between the original samples.
Why Upsampling?
Often audio hardware and software offer upsampling. When analog audio is converted to digital, it needs to be filtered so that no audio enters the analog-digital converter that is higher than half the sampling rate. The trick is to convert the digital signal to a higher sampling rate, say two or four times the original sampling rate. When done properly the audio information has not changed and thus does not contain more information, but since the signal now has a higher sampling rate, the analog filter doesn’t have to work so hard and thus causes less distortion.
Upsampling()
We have upsampled function in MATLAB that is used to increase the sampling rate of any function x[n] by sampling factor ‘L’. The basic syntax is written below.
y = upsample(a,n)
y = upsample(a,n,phase)
Here,
y = upsample(a,n) is the basic syntax of the upsampling function used in MATLAB where ‘a’ is the input signal and ‘n’ is the sampling factor. We will see an example of the function in the below code.
Suppose, we have a function x = [1 2 3 4] upsampling with a sampling factor of 3 and then downsample with the same sampling factor to get the original signal.
Here are the general steps to do upsampling in MATLAB:
Step 1: Define your input signal: The first step is to define the input signal that you want to upsample. The signal can be in the form of a vector or a matrix, depending on the application.
Step 2: Specify the upsampling factor: The upsampling factor determines the number of zeros to be inserted between each pair of consecutive samples in the signal. You need to specify the upsampling factor as an integer value.
Step 3: Use the upsample() function: MATLAB provides the upsample() function to perform upsampling on a signal. The function takes the input signal and the upsampling factor as its arguments and returns the upsampled signal.
Step 4: Visualize the results: Finally, you can visualize the original and upsampled signals to see the effects of upsampling on the signal. MATLAB provides several plotting functions, such as plot(), stem(), and scatter(), that can be used to plot the signals.
Example:
Matlab
clc
clear all
x = [1 2 3 4]
y = upsample(x,3)
stem(x)
subplot(4,1,2)
stem(y)
c = downsample(y,3)
subplot(4,1,3)
stem (c)
|
Output:
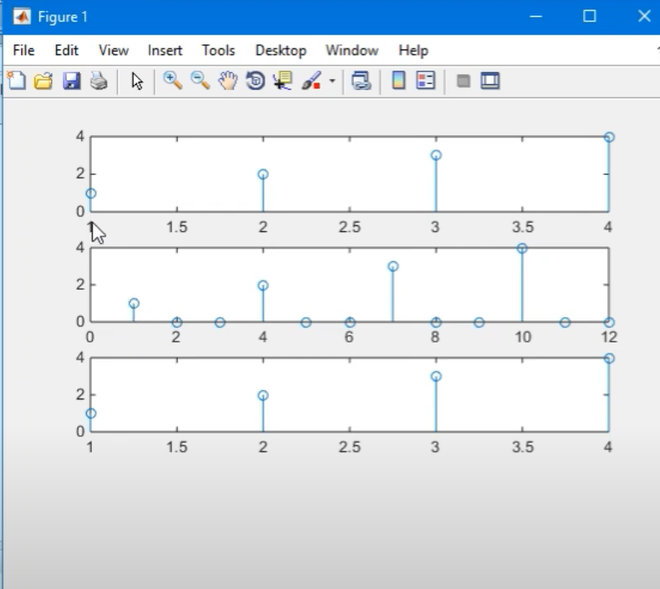
Fig 1 : Upsampling the function with the sampling factor of 3
Code Explanation:
The input signal is x has discrete values [1, 2, 3, 4 ]. The sampling factor of the upsample function is 3. Therefore the upsampled function expands the signal by adding (L-1) zeros between each sample i.e, n=3 then the number of zeros is 3-1 =2. We can see the expanded signal in the below output. Again the upsampled function is downsampled with the same scaling factor to retrieve the original signal. The ‘stem (x)’ function is used to basically plot the sequence of the data. The subplot(x,y,z) function splits the current figure into an x-by- y-axis and constructs axes in the part defined by z.
Like Article
Suggest improvement
Share your thoughts in the comments
Please Login to comment...