What is LabVIEW?
Last Updated :
09 Nov, 2022
Graphical Programming Technique is a technique where VISUAL BLOCK Connections are used to code instead of text which makes it easy for non-coders to implement algorithms.LabVIEW(Laboratory Virtual Instrument Engineering Workbench) is the first implementation of graphical programming to date, it continues to be the dominant graphical programming implementation. It provides a powerful and integrated environment for the development of various instrumental applications. An efficient LabVIEW application is designed without unnecessary operations, with minimal occupation including code, data, block diagram, front panel, and GUI updates. It eliminates human errors in data collection and process operations. It reduces data transcription errors and more reliable data available makes better quality control of products and new discoveries. LabVIEW programs are also called virtual instruments (VIs), because their appearance and operation imitate physical instruments. It contains a comprehensive set of VIs and functions for acquiring, analyzing, displaying, and storing data, as well as tools to help you troubleshoot your code. It also has built-in features for connecting user’s applications to the Web using the LabVIEW Web Server. It is used to manage large and professional applications and also integrated project management tools, integrated graphical debugging tools, and standardized source code control integration. LabVIEW provides the tools required for most applications and is also an open development environment.
Advantages of LabVIEW:
Some advantages of this technique over Text-based programming are :
- Graphical programming is highly interactive as compared to Text-based programming.
- In text-based programming, the syntax must be known but in Graphical programming, the syntax is knowledge but not required.
- Front panel design requires extra coding in the case of text-based programming but in the case of Graphical programming, no extra coding is required.
- Errors are indicated as we wire blocks in graphical programming while in Text-based programming, to check error, the program has to be compiled.
Features of LabVIEW:
Some other features of Graphical Programming are:
- User-friendly UI: It has a user-friendly drag and drop kind of interactive User Interface.
- Built-in Functions: It supports thousands of inbuilt functions that range from analysis and I/O etc. These belong to the function palette.
- Scalable: As LabVIEW has a modular design making it easy to scale and modular programs.
- Professional Development Tools: It has a plethora of tools that help integrate and debug large applications.
- Open environment: It has tools needed for many open environment developments.
- Object–oriented design: It supports object-oriented programming structures enabling encapsulation and inheritance to create modular and extensible code.
- Compiled language: Being a compiled language it is faster.
Role of components :
- A LabVIEW constitutes a graphical programming environment which allows user to design and analyze any complicated system in a shorter time as compared with the text-based programming environment.
- The LabVIEW graphical programs are called virtual instruments.
- When data is available at all the inputs, the block or the graphical component is executed.
- After the execution is completed, the data is supplied to output terminals, and then it is passed to the next block in the dataflow path.
Front panel:
The front panel allows the user to interact with the VI by displaying outputs and allowing the user to supply the program with inputs.
Main front panel objects are:
Controls and Indicators:
- The controls simulate the input devices and supply the data to the block diagram of the VI. The common controls are knobs, pushbuttons, dials, and other input devices.
- The indicators Simulate output devices and display data that is acquired or generated by the block diagram. The common indicators are graphs, Light Emitting Diodes(LEDs), meters, and other output devices.
Back Panel:
- The back panel consists of the code used by the VI to obtain inputs from the front panel, operate on the inputs, and display the results.
- The back panel is also known as the block diagram.
- Block diagram controls the program through graphical code.
- In the block diagram, the code is added using a graphical representation of functions that control the front panel objects.
- The back panel contains structures and functions that perform operations on controls and supply data to indicators.
The three different palettes available in LabVIEW are :
1. Tool Palette
- A tool is a special operating mode of the mouse cursor. The cursor corresponds to the icon of the tool selected in the Tools palette.
- Using Tool Palette users can create, modify and debug Virtual Instruments.
- The tool palette is available on both the front panel and the Block Diagram.
Different tools available are as follows :
- Operating tool button: For text selection or for changing the values of controls.
- Positioning Tool: For resizing, selecting, and positioning.
- Labelling Tool: For free labels and editing text.
- Object shortcut Menu Tool: For opening the shortcut menu of an object.
2. Controls Palette:
- The Controls Palette is available only on the Front panel.
- It consists of various controls and indicators which are required by the user while building the front panel.
3. FUNCTION PALETTE
It is available only on the Block Diagram and is used to build Block Diagram.
Different function palettes include :
- Numeric
- Array
- Time and Dialog
- Waveform
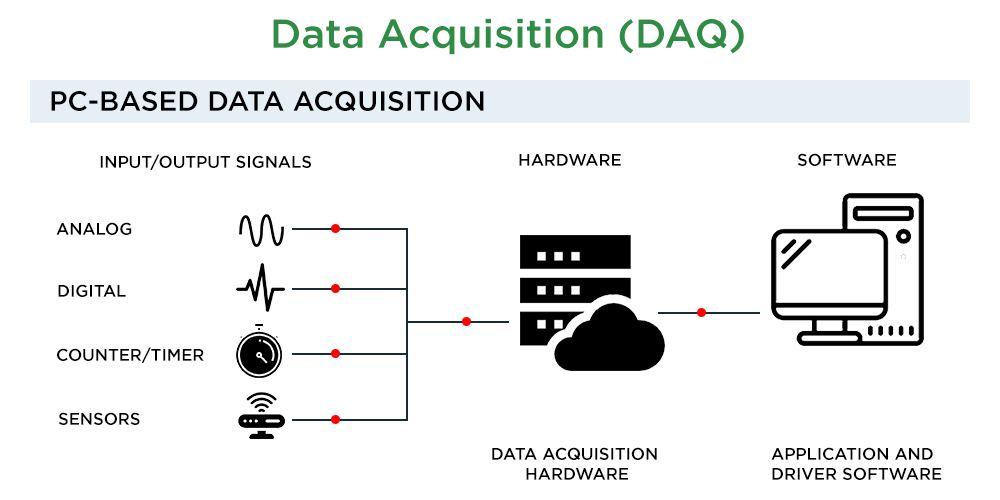
LabVIEW has built-in libraries for integrating stand-alone instruments, data acquisition devices, motion control, and vision products. For instance, take a look at the below image depicting Data Acquisition(DAQ):
Like Article
Suggest improvement
Share your thoughts in the comments
Please Login to comment...