When dealing with Data Science in the R Programming Language, the Tidyverse packages are your best friends! These Tidyverse packages were specially designed for Data Science with a common design philosophy.
They include all the packages required in the data science workflow, ranging from data exploration to data visualization. For example, readr is for data importing, tibble and tidyr help in tidying the data, dplyr and stringr contribute to data transformation and ggplot2 is vital for data visualization.

Tidyverse Packages in R
There are eight core Tidyverse packages namely ggplot2, dplyr, tidyr, readr, purrr, tibble, stringr, and forcats that are mentioned in this article. All of these packages are loaded automatically at once with the install.packages(“tidyverse”) command.
In addition to these packages, Tidyverse also has some specialized packages that are not loaded automatically but need their own call. These include the DBI for relational databases. httr for web APIs, rvest for web scraping, etc. Now, let’s see the core Tidyverse packages and learn more about them.
Tidyverse Packages in R following:
- Data Visualization and Exploration
- Data Wrangling and Transformation
- dplyr
- tidyr
- stringr
- forcats
- Data Import and Management
- Functional Programming
Data Visualization and Exploration in Tidyverse in R
1. ggplot2:
ggplot2 is an R data visualization library that is based on The Grammar of Graphics. ggplot2 can create data visualizations such as bar charts, pie charts, histograms, scatterplots, error charts, etc. using high-level API. It also allows you to add different types of data visualization components or layers in a single visualization.
Once ggplot2 has been told which variables to map to which aesthetics in the plot, it does the rest of the work so that the user can focus on interpreting the visualizations and take less time in creating them. But this also means that it is not possible to create highly customized graphics in ggplot2. But there are a lot of resources in the RStudio community and Stack Overflow which can provide help in ggplot2 when needed.
If you want to install ggplot2, the best method is to install the tidyverse using:
install.packages("tidyverse")
Or you can just install ggplot2 using:
install.packages("ggplot2")
You can also install the development version from GitHub using:
devtools::install_github("tidyverse/ggplot2")
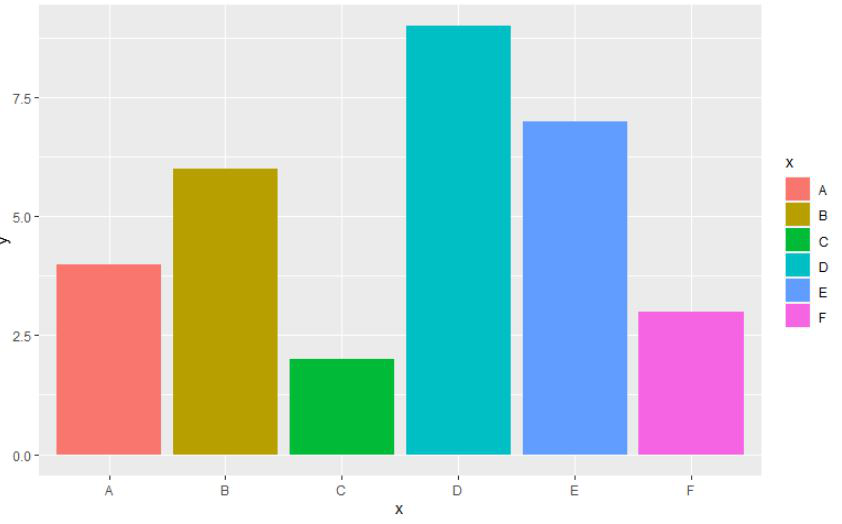
We will be using 6 different data points for the bar plot and then with the help of the fill argument within the aes function, we will be applying the default colors to the barplot in the R programming language.
R
library("ggplot2")
gfg <-data.frame(
x=c('A', 'B', 'C', 'D', 'E', 'F'),
y=c(4, 6, 2, 9, 7, 3))
ggplot(gfg, aes(x, y, fill=x)) + geom_bar(stat="identity")
|
Output:
Data Wrangling and Transformation in Tidyverse in R
1. dplyr:
dplyr is a very popular data manipulation library in R. It has five important functions that are combined naturally with the group_by() function that can help in performing these functions in groups.
These functions include the mutate() function which can add new variables that are functions of existing variables, select() function that selects the variables based on their names, filter() function that picks selects the variables based on their values.
summarise() function that reduces multiple values into a summary, and the arrange() function that arranges the arranges the row orderings. If you want to install dplyr, the best method is to install the tidyverse using:
install.packages("tidyverse")
Or you can just install dplyr using:
install.packages("dplyr")
You can also install the development version from GitHub using:
devtools::install_github("tidyverse/dplyr")
R
library(dplyr)
print(starwars %>% filter(species == "Droid"))
|
Output:
# A tibble: 6 x 14
  name   height  mass hair_color skin_color  eye_color birth_year sex   gender
  <chr>   <int> <dbl> <chr>      <chr>       <chr>          <dbl> <chr> <chr>
1 C-3PO     167    75 <NA>       gold        yellow           112 none  masculi~
2 R2-D2      96    32 <NA>       white, blue red               33 none  masculi~
3 R5-D4      97    32 <NA>       white, red  red               NA none  masculi~
4 IG-88     200   140 none       metal       red               15 none  masculi~
5 R4-P17     96    NA none       silver, red red, blue         NA none  feminine
6 BB8        NA    NA none       none        black             NA none  masculi~
# ... with 5 more variables: homeworld <chr>, species <chr>, films <list>,
#   vehicles <list>, starships <list>
2. tidyr:
tidyr is a data cleaning library in R which helps to create tidy data. Tidy data means that all the data cells have a single value with each of the data columns being a variable and the data rows being an observation.
This tidy data is a staple in the tidyverse and it ensures that more time is spent on data analysis and to obtain value from data rather than cleaning the data continuously and modifying the tools to handle untidy data.
The functions in tidyr broadly fall into five categories namely, Pivoting which changes the data between long and wide forms, Nesting which changes grouped data so that a group is a single row with a nested data frame, Splitting character columns and then combining them, Rectangling which converts nested lists into tidy tibbles and converting implicit missing values into explicit values. If you want to install tidyr, the best method is to install the tidyverse using:
install.packages("tidyverse")
Or you can just install tidyr using:
install.packages("tidyr")
You can also install the development version from GitHub using:
devtools::install_github("tidyverse/tidyr")
The gather() function in tidr will take multiple columns and collapse them into key-value pairs, duplicating all other columns as needed.
R
library(tidyr)
n = 10
tidy_dataframe = data.frame(
S.No = c(1:n),
Group.1 = c(23, 345, 76, 212, 88,
199, 72, 35, 90, 265),
Group.2 = c(117, 89, 66, 334, 90,
101, 178, 233, 45, 200),
Group.3 = c(29, 101, 239, 289, 176,
320, 89, 109, 199, 56))
print(head(tidy_dataframe))
long <- tidy_dataframe %>%
gather(Group, Frequency,
Group.1:Group.3)
print(head(long))
|
Output:
  S.No Group.1 Group.2 Group.3
1    1      23     117      29
2    2     345      89     101
3    3      76      66     239
4    4     212     334     289
5    5      88      90     176
6    6     199     101     320
print the data frame in a long format
  S.No   Group Frequency
1    1 Group.1        23
2    2 Group.1       345
3    3 Group.1        76
4    4 Group.1       212
5    5 Group.1        88
6    6 Group.1       199
3. Stringr:
stringr is a library that has many functions used for data cleaning and data preparation tasks. It is also designed for working with strings and has many functions that make this an easy process. stringr is built on top of stringi, which is an International Components for Unicode C library.
So if there are any functions that you want to use but cannot find in stringr, then the best place to look for them is stringi. This also means that once you master stringr, stringi is not that difficult to use as both of these packages have similar conventions.
All of the functions in stringr start with str and they take a string vector as their first argument. Some of these functions include str_detect(), str_extract(), str_match(), str_count(), str_replace(), str_subset(), etc. If you want to install stringr, the best method is to install the tidyverse using:
install.packages("tidyverse")
Or you can just install stringr from CRAN using:
install.packages("stringr")
You can also install the development version from GitHub using:
devtools::install_github("tidyverse/stringr")
R
library(stringr)
str_length("hello")
|
Output:
5
4. Forcats:
forcats is a R library that is concerned with handling problems associated with vectors. These vectors are variables that have a fixed set of possible values they can take which is already known in advance. So forecast deals with issues like changes the orders of values in vectors, reordering the vectors, etc.
Some of the functions in forcats are fct_relevel() that reorders a vectors by hand, fct_reorder() that reorders a factor using another variable, fct_infreq() that reorders a factorby frequency values etc. If you want to install forcats, the best method is to install the tidyverse using:
install.packages("tidyverse")
Or you can just install forcats from using:
install.packages("forcats")
You can also install the development version from GitHub using:
devtools::install_github("tidyverse/forcats")
R
library(forcats)
library(dplyr)
library(ggplot2)
print(head(starwars %>% filter(!is.na(species))
%>% count(species, sort = TRUE)))
|
Output:
# A tibble: 6 x 2
  species      n
  <chr>    <int>
1 Human       35
2 Droid        6
3 Gungan       3
4 Kaminoan     2
5 Mirialan     2
6 Twi'lek      2
Data Import and Management in Tidyverse in R
1. readr:
This readr library provides a simple and speedy method to read rectangular data such as that with file formats tsv, csv, delim, fwf, etc. readr can parse many different types of data using a function that parses the total file and another that focuses on the specific column.
This column specification defines the method to convert the data in the column from a character vector to the data type that is most suited. This is done automatically by readr in most cases.
readr can read different kinds of file formats using different functions, namely read_csv() for comma-separated files, read_tsv() for tab-separated files, read_table() for tabular files, read_fwf() for fixed-width files, read_delim() for delimited files, and, read_log() for web log files. If you want to install readr, the best method is to install the tidyverse using:
install.packages("tidyverse").
Or you can just install readr using:
install.packages("readr").
You can also install the development version from GitHub using:
devtools::install_github("tidyverse/readr")
Reading file with readr library.
R
library(readr)
myData = read_tsv("geeksforgeeks.txt", col_names = FALSE)
print(myData)
|
Output:
# A tibble: 1 x 1
  X1

1 A computer science portal for geeks.
2. tibble:
A tibble is a form of a data.frame which includes the useful parts of it and discards the parts that are not so important. So tibbles don’t change variables names or types like data.frames nor do they do partial matching but they bring problems to the forefront much sooner such as when a variable does not exist.
So a code with tibbles is much cleaner and effective than before. Tibbles is also easier to use with larger datasets that contain more complex objects, in part before an enhanced print() method.
You can create new tibbles from column vectors using the tibble() function and you can also create a tibble row-by-row using a tribble() function. If you want to install tibble, the best method is to install the tidyverse using:
install.packages("tidyverse"):
Or you can just install tibble using:
install.packages("tibble")
You can also install the development version from GitHub using:
devtools::install_github("tidyverse/tibble")
R
library(tibble)
data <- data.frame(a = 1:3, b = letters[1:3],
c = Sys.Date() - 1:3)
print(data)
|
Output:
  a b          c
1 1 a 2021-11-24
2 2 b 2021-11-23
3 3 c 2021-11-22
Functional Programming in Tidyverse in R
1. purrr:
Purrr is a detailed set of tools for functions and vectors and it is mainly used to manage the functional programming in R.
A good example of this is the map() functions that are used to replace multiple for loops that complicate and mess up the code into simpler code that is easy to read. In addition to that, all purrr functions are type-stable
which means they either return the advertised output type and if that is not possible, then the give an error. If you want to install purrr, the best method is to install the tidyverse using:
install.packages("tidyverse")
Or you can just install purrr using:
install.packages("purrr")
You can also install the development version from GitHub using:
devtools::install_github("tidyverse/purrr")
R
library(purrr)
mtcars %>%
split(.$cyl) %>%
map(~ lm(mpg ~ wt, data = .)) %>%
map(summary) %>%
map_dbl("r.squared")
|
Output:
        4         6         8
0.5086326 0.4645102 0.4229655
Like Article
Suggest improvement
Share your thoughts in the comments
Please Login to comment...