VS Code | Build, Run and Debug in C++
Last Updated :
12 Sep, 2023
In this article, we will discuss the VS Code setup required for break-point debugging. Firstly create a file launch.json that configures the VS Code to launch the GDB debugger at the beginning of the debugging process. Then create a file tasks.json that tells VS Code how to build (compile) the program. Finally, make some changes to the console settings and implements the build and debugging.
Program:
Let below be the code for the demonstrate purposes:
C++
#include <bits/stdc++.h>
using namespace std;
int main()
{
int a, b, pow = 1;
cin >> a >> b;
for (int i = 1; i <= b; i++) {
pow = pow * a;
}
cout << pow;
}
|
Launch.json
This file pertains to information like the name of the debugger, path to the debugger, current CPP file’s directory, and console regarding data. Below is the code in the file launch.json:
{
    // Use IntelliSense to learn
    // about possible attributes.
    // Hover to view descriptions
    // of existing attributes.
    // For more information, visit:
    // https://go.microsoft.com/fwlink/?linkid=830387
    "version": "0.2.0",
    "configurations": [
        {
            "name": "g++.exe - Build and debug active file",
            "type": "cppdbg",
            "request": "launch",
            "program": "${fileDirname}
              \\${fileBasenameNoExtension}.exe",
              // There I have got error Property keys must be doublequotedjsonc
            "args": [],
            "stopAtEntry": false,
            "cwd": "${workspaceFolder}",
            "environment": [],
            "externalConsole": true,
            "MIMode": "gdb",
            "miDebuggerPath": "C:\\MinGW\\bin\\gdb.exe",
            "setupCommands": [
                {
                    "description": "Enable pretty-printing for gdb",
                    "text": "-enable-pretty-printing",
                    "ignoreFailures": true
                }
            ],
            "preLaunchTask": "C/C++: g++.exe build active file"
        }
    ]
}
Important terms in launch.json: You can either use entirely code given above or otherwise you may use the code generated in your machine automatically. In both cases, you have to take some precautions. Firstly, make sure that the attribute “externalConsole” is marked as true (we will understand its significance later in this topic). Then check whether the property “miDebuggerPath” points to the gdb debugger correctly. Let us discuss these attributes in detail:
- name and type: These are quite self-explanatory, these refer to the name and type of launch.json.
- request: states the type of JSON file.
- program: stores the detailed address of the program for which launch.json file.
- cwd: denotes current working directory. Note that all the addresses in launch.json file are in general form, they are not specific to any file.
- externalConsole: as there is no way to handle input/output in VS Code’s integrated terminal, use an external console for this. So set it to true.
- miDebuggerPath: points to the location of debugger, this will vary from user to user.
- preLaunchTask: this contains the name of tasks.json file.
Note: If you are not able to find any of the executable listed above (such as gdb.exe or g++.exe), you may have to install them manually. You can use MinGW Install Manager to install the required components.
Steps:
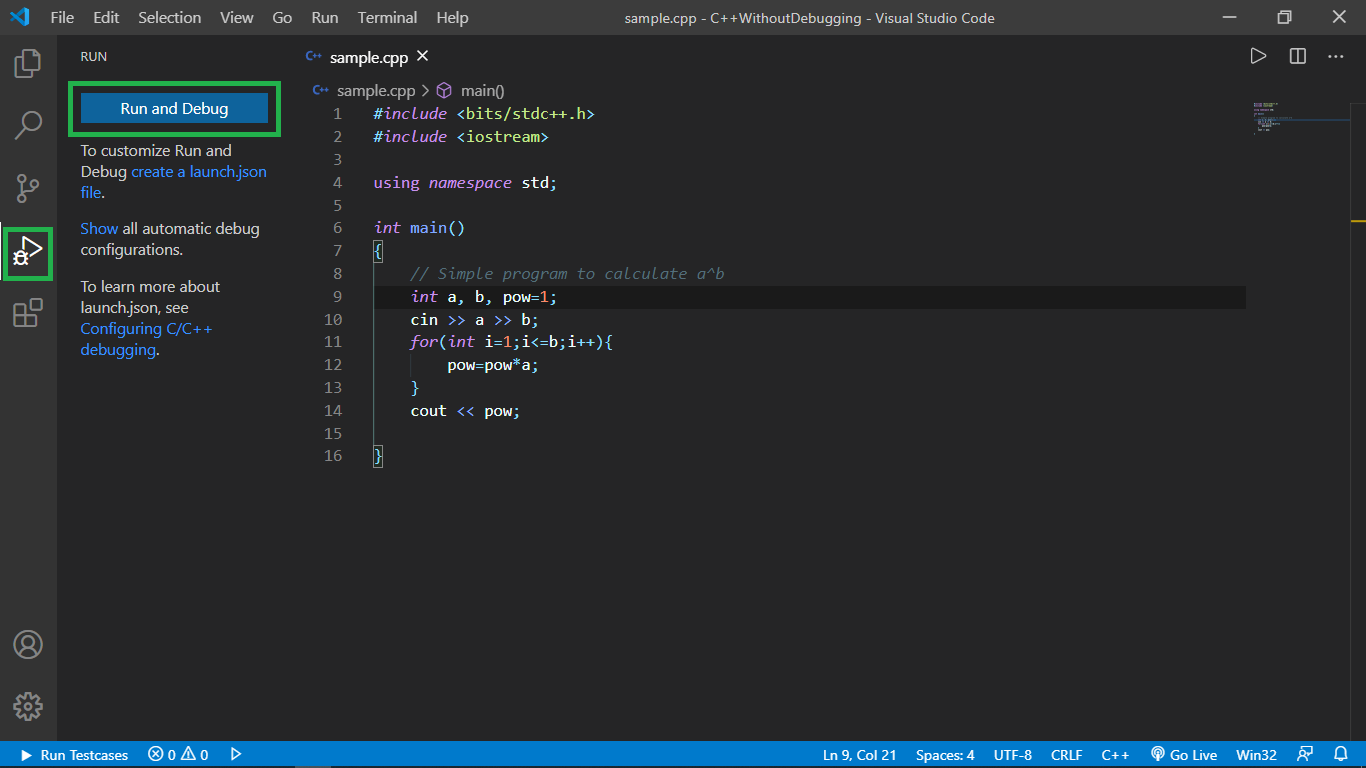
- Go to the Run tab on the left of the screen and click on Run and Debug.
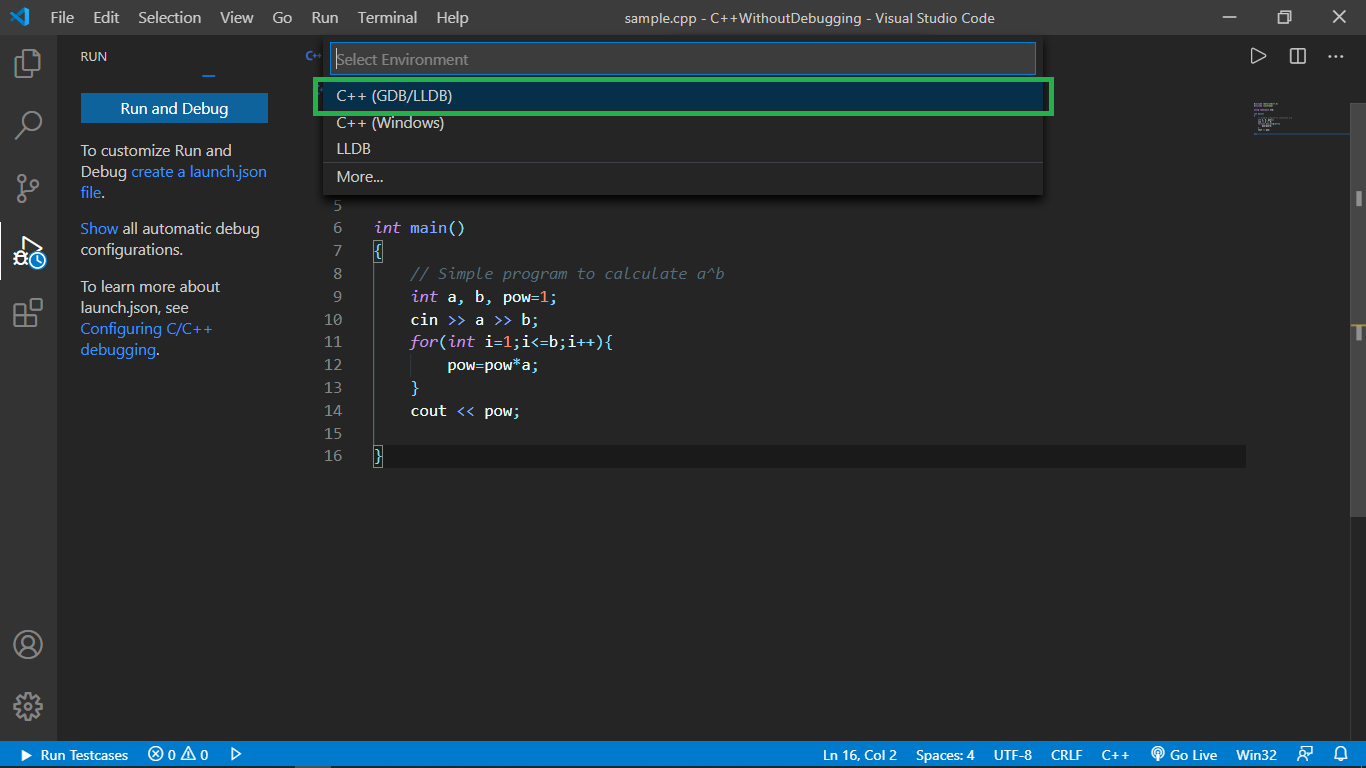
- You will be asked to choose the debugger, choose C++(GDB/LLDB). Note this option will appear only if you have MinGW installed and configured in your PC.(Refer to this article to install and configure MinGW).
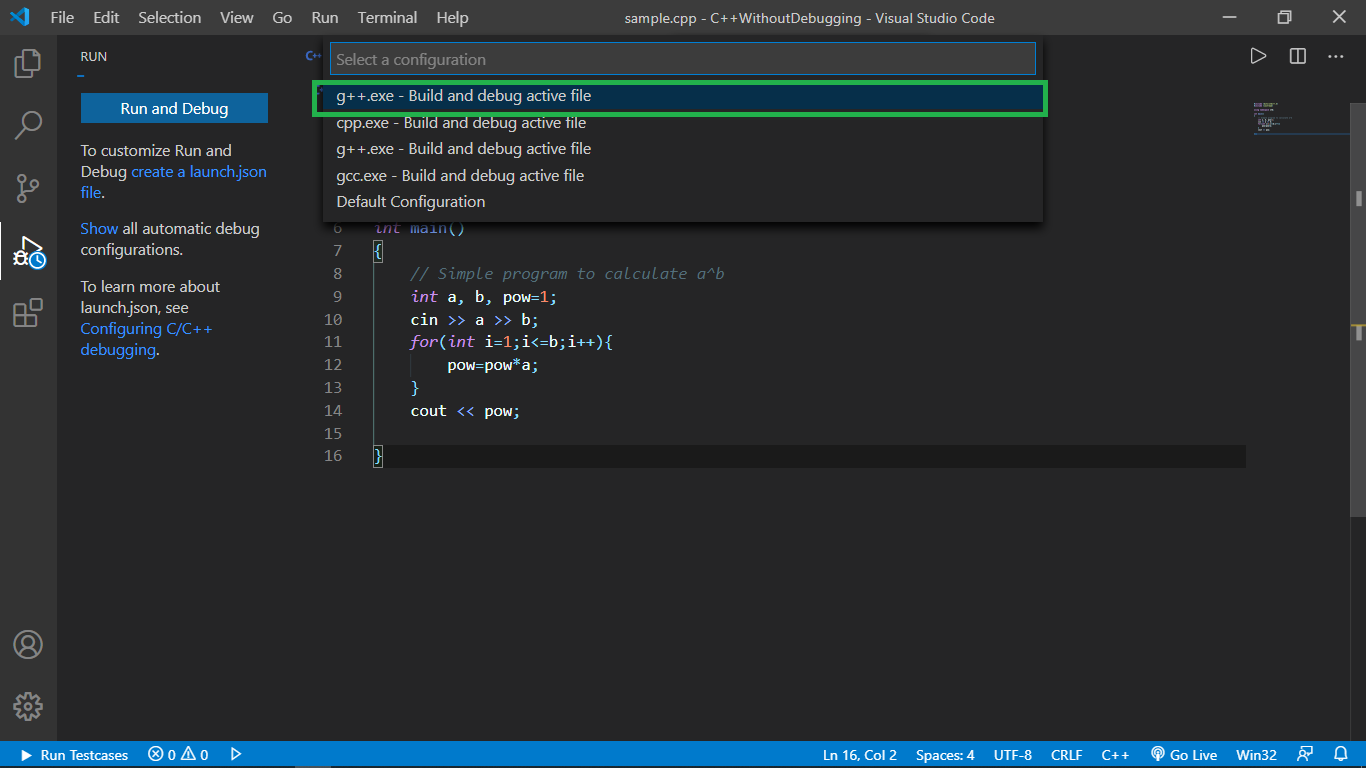
- Then choose “g++.exe – Build and debug active file”. It refers to g++ GNU C++ compiler.
- After this a Launch.json file will appear, you may either use it or the one I provided above. Again make sure the externalConsole is marked true and miDebuggerPath is set correctly.
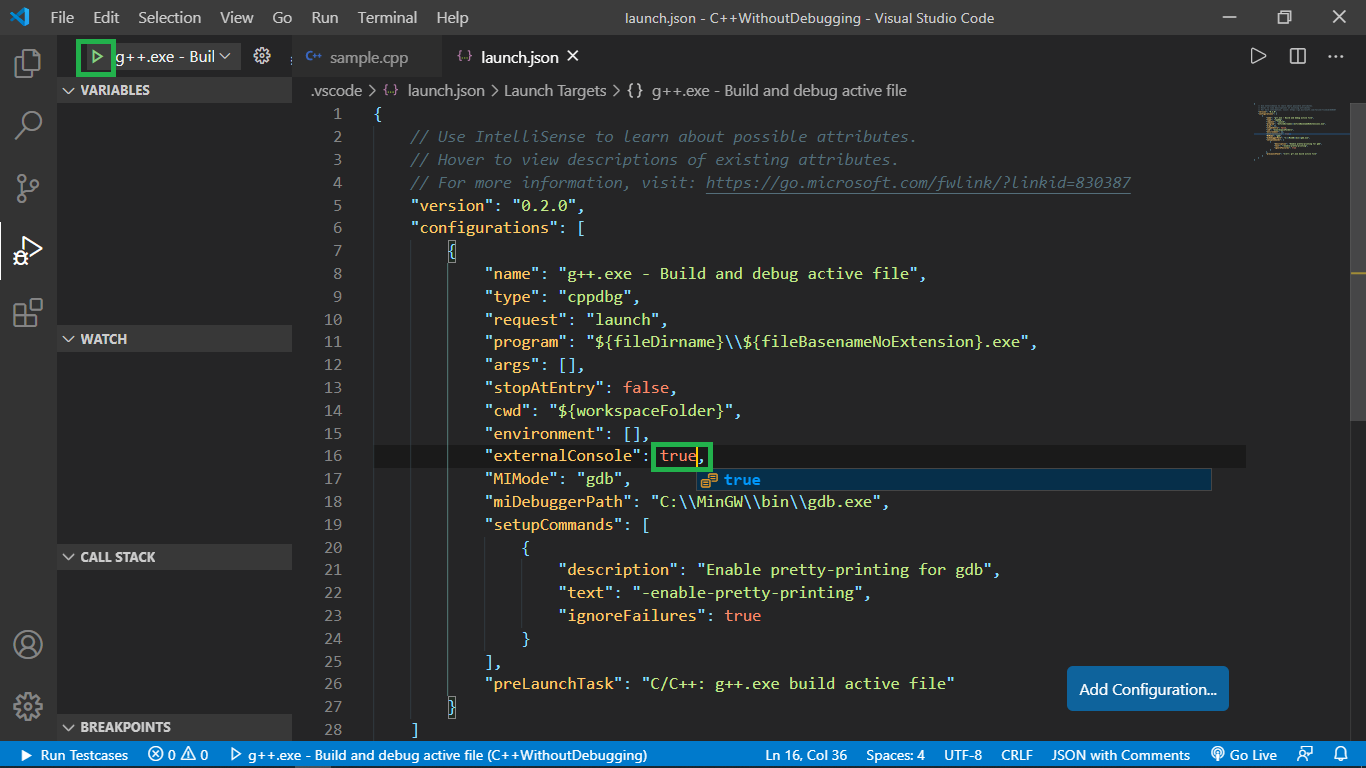
- After this click the play button on the top left of the screen and move on to the tasks.json file.
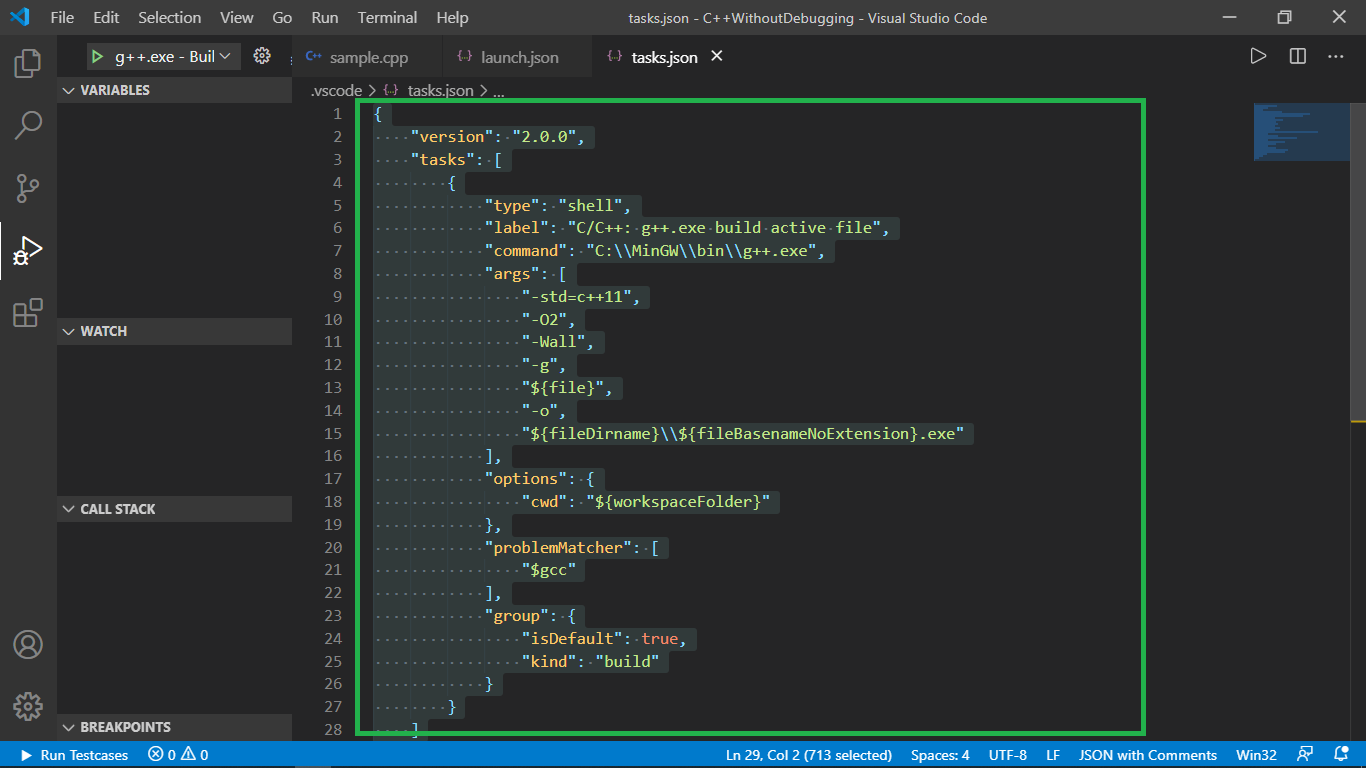
Tasks.json:
This file contains information like the commands used for compilation, the compiler’s address, the same label as in launch.json, and some other information. Below is the code in the file task.json:
{
    "version": "2.0.0",
    "tasks": [
        {
            "type": "shell",
            "label": "C/C++: g++.exe build active file",
            "command": "C:\\MinGW\\bin\\g++.exe",
            "args": [
                "-std=c++11",
                "-O2",
                "-Wall",
                "-g",
                "${file}",
                "-o",
                "${fileDirname}
                 \\ ${fileBasenameNoExtension}.exe"
            ],
            "options": {
                "cwd": "${workspaceFolder}"
            },
            "problemMatcher": [
                "$gcc"
            ],
            "group": {
                "isDefault": true,
                "kind": "build"
            }
        }
    ]
}
Important terms in task.json: The above mentioned tasks.json file can be used entirely without caution. However, the only thing to take care of is that the label of tasks.json should match with preLaunchTask of Launch.json. Let’s discuss some terms in more detail:
- label: this is unique to a tasks.json file and is used by launch.json to call tasks.json before its execution.
- command: this points to the g++ compiler application, as it will be used in compilation
- args: these arguments along with command when concatenated look like that is exactly the command we use for the compilation of CPP file and creation of the executable file as:
g++ -std=c++11 -O2 -Wall ${file} -o ${fileDirname}\\${fileBasenameNoExtension}.exe
Steps:
- From the last step of launch.json we had clicked on the play button on the top left, now a dialogue box appears, which says that there is no tasks.json file in the current directory. Therefore, we need to create one, so Click on the Configure Task.

- Then click on Create tasks.json file from a template.
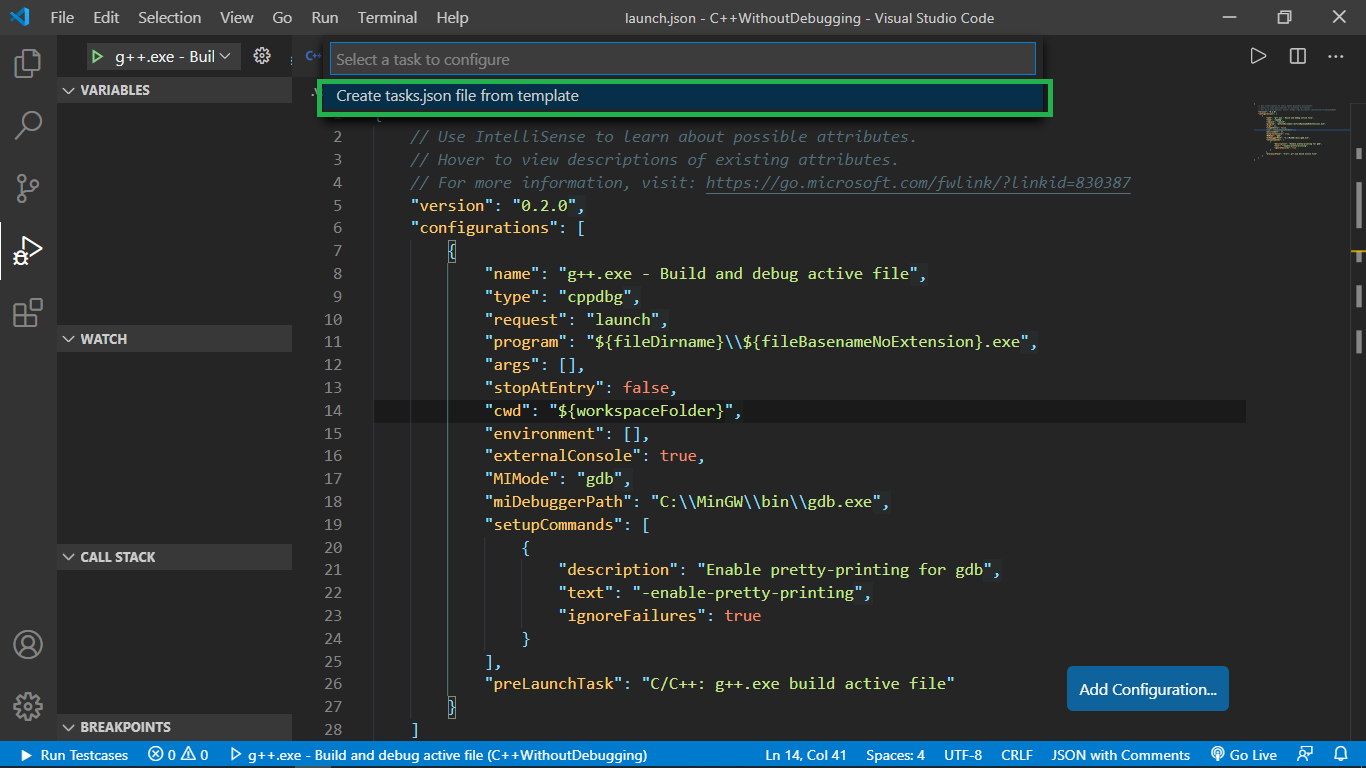

- Paste the code provided above in the newly created tasks.json file. Make sure to delete the existing code before doing so.
Console Adjustments
Steps:
- One point that is already covered is that externalConsole in launch.json has to be true.
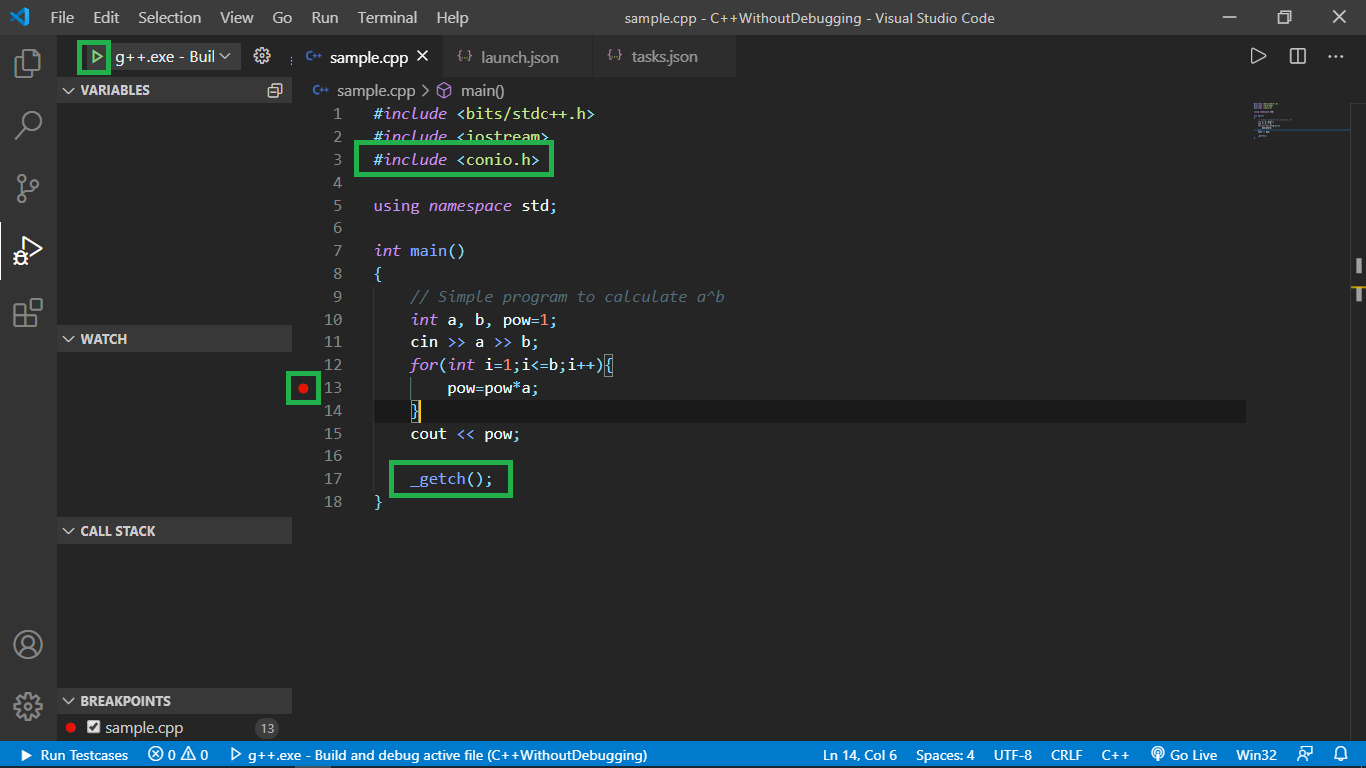
- Now, include conio.h header file in our program and call get-character method at last of our main() function. This will stop the command prompt from disappearing immediately after the execution completes so that we get time to examine the output until we press any character. Now the code becomes:
C++
#include <bits/stdc++.h>
#include <conio.h>
using namespace std;
int main()
{
int a, b, pow = 1;
cin >> a >> b;
for (int i = 1; i <= b; i++) {
pow = pow * a;
}
cout << pow;
_getch();
}
|
- Put a red break-point at some line of code that we want to examine/debug.
- Then we click on the play button on the top left of the screen to start the build.
Break-point Debugging:
Steps:
- In the appeared command prompt, we enter the required input and press enter.
- We notice that the execution begins and it pauses at the mentioned break-point.

- Now there are some options, we can either continue, step over, step into, step out-of, or restart the execution. You can do whatever you like to debug your code.
- Also, notice the value of all variables at that time of execution on the left of the screen.

- Debug as you want and as much as you want, then after the entire execution is over, go to the command prompt and notice the output there.

- After you have finished examining the output, press any key to close the command prompt.
Like Article
Suggest improvement
Share your thoughts in the comments
Please Login to comment...