Visualizing Missing Data with Barplot in R
Last Updated :
07 Mar, 2022
In this article, we will discuss how to visualize missing data with barplot using R programming language.
Missing Data are those data points that are not recorded i.e not entered in the dataset. Usually, missing data are represented as NA or NaN or even an empty cell.
Dataset in use:
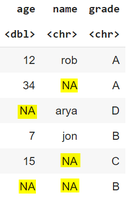
In the case of larger datasets, few missing data might not affect the overall information whereas it can be a huge loss in information in the case of smaller datasets. These missing data are removed or imputed depending on the dataset. To decide how to deal with missing data we’ll first see how to visualize the missing data points.
Let us first count the total number of missing values.
Example: Counting missing values
R
age = c(12,34,NA,7,15,NA)
name = c('rob',NA,"arya","jon",NA,NA)
grade = c("A","A","D","B","C","B")
df <- data.frame(age,name,grade)
sum(is.na(df))
|
Output:
5
We can also find out how many missing values are there in each attribute/column.
Example: Count missing values in each attribute/column
R
age = c(12,34,NA,7,15,NA)
name = c('rob',NA,"arya","jon",NA,NA)
grade = c("A","A","D","B","C","B")
df <- data.frame(age,name,grade)
sapply(df, function(x) sum(is.na(x)))
|
Output:
age name grade
2   3    0
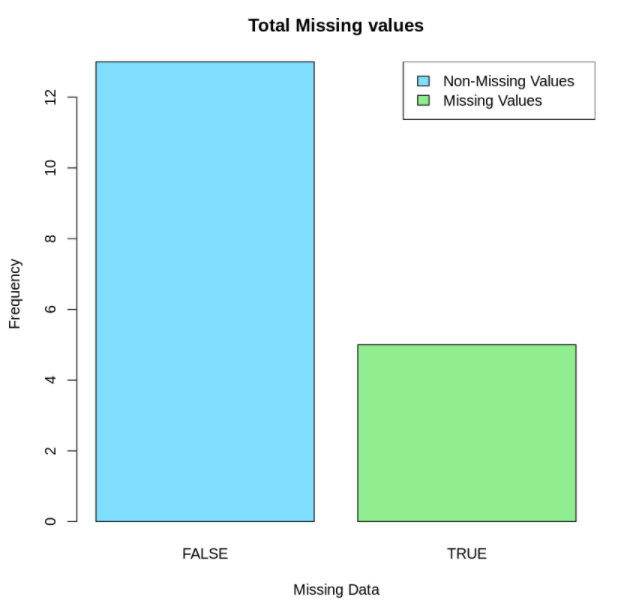
Visualizing all missing values
Let’s first visualize the frequencies for missing and non-missing values for entire data using barplot( ) function in R.
Syntax of barplot():
barplot(x, name.args = NULL, col = ” “, main = ” ” , xlab = ” “, ylab = ” ” , beside = FALSE , horiz = TRUE …)
Parameters:
- x : vector or matrix
- names.arg : label for each bar
- col : color for the bars
- main : title of the barplot
- xlab : label for x-axis
- ylab : label for y-axis
- beside : to specify grouped or stacked barplot
- horiz : orientation of bars (horizontal or vertical)
Example: Visualizing all missing values
R
age = c(12,34,NA,7,15,NA)
name = c('rob',NA,"arya","jon",NA,NA)
grade = c("A","A","D","B","C","B")
df <- data.frame(age,name,grade)
freqDf <- data.frame(table(is.na(df)))
barplot(freqDf$Freq , main = "Total Missing values",
xlab = "Missing Data", ylab = "Frequency",
names.arg = c("FALSE","TRUE"),
col = c("#80dfff","lightgreen"))
legend("topright",
c("Non-Missing Values","Missing Values"),
fill = c("#80dfff","lightgreen"))
|
Output:
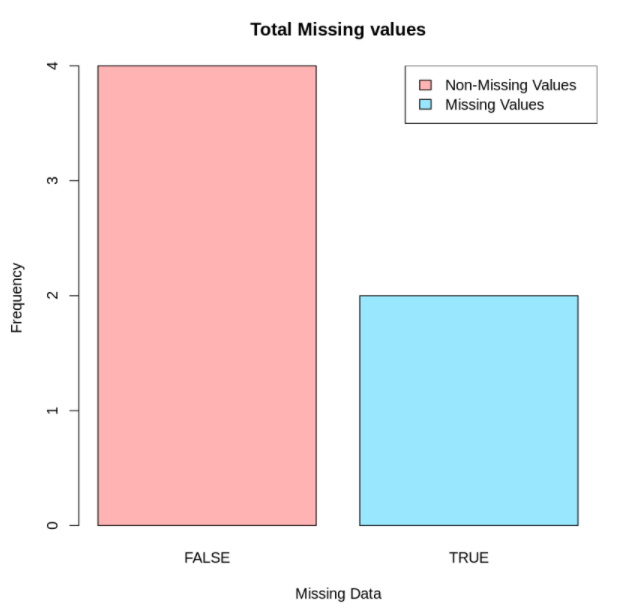
Visualizing missing data for one column
For this, we select the column that we are trying to visualize and then do the needful.
Example: Visualizing missing data for one column
R
age = c(12,34,NA,7,15,NA)
name = c('rob',NA,"arya","jon",NA,NA)
grade = c("A","A","D","B","C","B")
df <- data.frame(age,name,grade)
freqDf2 <- data.frame(table(is.na(df$age)))
barplot(freqDf2$Freq,
main = "Total Missing values",xlab = "Missing Data",
ylab = "Frequency",names.arg = c("FALSE","TRUE"),
col = c("#ffb3b3","#99e6ff"))
legend("topright",
c("Non-Missing Values","Missing Values"),
fill = c("#ffb3b3","#99e6ff"))
|
Output:
Visualizing missing data for all columns
Let’s create a function to transform the dataframe to a binary TRUE/FALSE matrix and then visualize it using a barplot in R.
Example: Visualizing missing data for all columns
R
age = c(12,34,NA,7,15,NA)
name = c('rob',NA,"arya","jon",NA,NA)
grade = c("A","A","D","B","C","B")
df <- data.frame(age,name,grade)
toBinaryMatrix <- function(df){
m<-c()
for(i in colnames(df)){
x<-sum(is.na(df[,i]))
m<-append(m,x)
m<-append(m,nrow(df)-x)
}
a<-matrix(m,nrow=2)
rownames(a)<-c("TRUE","FALSE")
colnames(a)<-colnames(df)
return(a)
}
binMat = toBinaryMatrix(df)
binMat
|
Output:
       age    name  grade
TRUE    2     3       0
FALSE    4     3       6
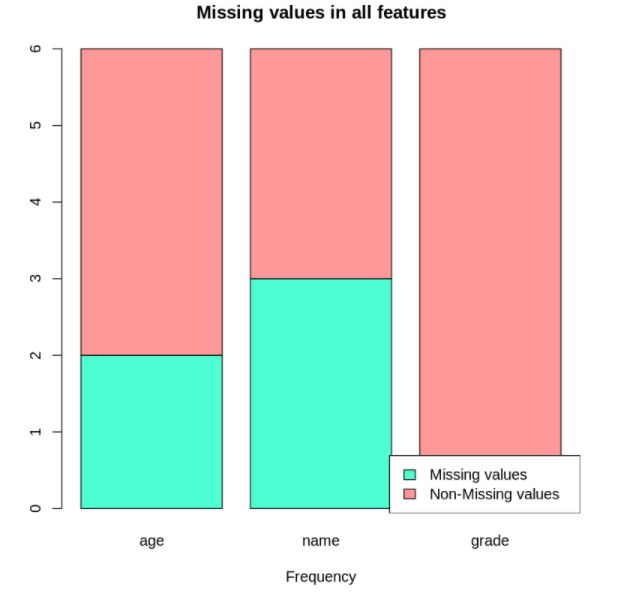
Stacked barplot
The missing values can be represented in contrast with the values present using a stacked barplot.
Example: Stacked barplot
R
age = c(12,34,NA,7,15,NA)
name = c('rob',NA,"arya","jon",NA,NA)
grade = c("A","A","D","B","C","B")
df <- data.frame(age,name,grade)
barplot(binMat,
main = "Missing values in all features",xlab = "Frequency",
col = c("#4dffd2","#ff9999"))
legend("bottomright",
c("Missing values","Non-Missing values"),
fill = c("#4dffd2","#ff9999"))
|
Output:
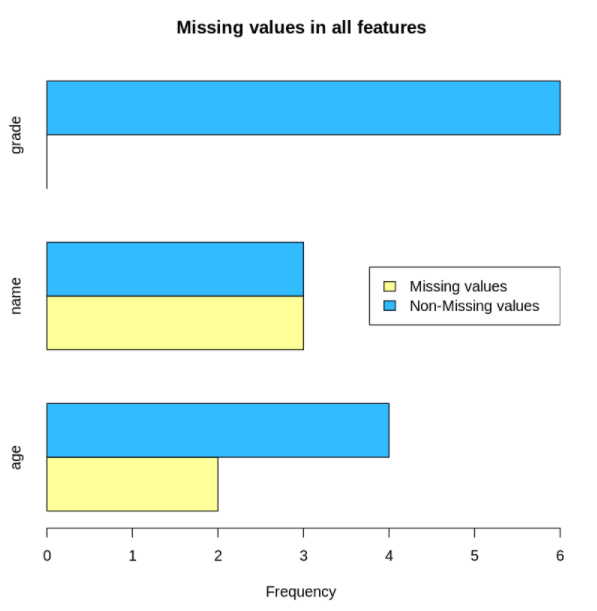
Grouped barplot
Another visualization that can be helpful is a grouped barplot.
Example: Grouped barplot
R
age = c(12,34,NA,7,15,NA)
name = c('rob',NA,"arya","jon",NA,NA)
grade = c("A","A","D","B","C","B")
df <- data.frame(age,name,grade)
barplot(binMat,
main = "Missing values in all features",xlab = "Frequency",
col = c("#ffff99","#33bbff"),beside=TRUE,
horiz = TRUE)
legend("right",c("Missing values","Non-Missing values"),
fill = c("#ffff99","#33bbff"))
|
Output:
Share your thoughts in the comments
Please Login to comment...