Venn Diagram: A Venn Diagram is a diagram that illustrates the logical relationship between sets and their elements. Venn diagrams utilize intersecting circles or various shapes to visually represent the logical connections among multiple sets of elements.
They are commonly used to categorize items graphically, underscoring their similarities and distinctions. In this article, we will discuss all the topics related to the Venn diagram, such as its definition, examples, and various terms related to it. We have also provided questions on Venn Diagrams.

Venn Diagram
What is Venn Diagram?
Venn Diagrams are used to represent the groups of data in circles, if the circles are overlapping, some elements in the groups are common, if they are not overlapping, there is nothing common between the groups or sets of data.
The sets are represented as circles and the circles are shown inside the rectangle which represents the Universal set. A universal set contains all the circles since it has all the elements present involving all the sets.
Venn Diagram Definition
A Venn diagram is a graphical representation used to illustrate the relationships between different sets. It consists of overlapping circles, each representing a set. The points where the circles overlap indicate the elements that are common to the sets, while the areas of the circles that do not overlap represent elements that are unique to their respective sets.
Who invented Venn Diagrams?
John Venn, a famous logician gave the concept of diagrams in 1918, this is why the diagrams are named Venn diagrams.
There are several benefits of Venn Diagrams,
- Venn diagram is used for the classification of data belonging to the same category but different sub-categories.
- The comparison of the different data becomes easier through the Venn diagram, as well as the relationship between the data.
- Grouping the information and finding similarities and differences among them becomes easy.
- The different unknown parameters can be easily understood and found with the help of Venn diagrams.
Venn Diagram Examples
Venn diagrams are highly useful in solving problems of sets and other problems. Venn diagrams are useful in representing the data in picture form. Let’s learn more about the Venn diagram through an example,
Example: Take a set A representing even numbers up to 10 and another set B representing natural numbers less than 5 then their interaction is represented using the Venn diagram.
Solution:

The concept of the Venn diagram is very useful for solving a variety of problems in Mathematics and others. To understand more about it let’s learn some important terms related to it.
Universal Set
Universal Set is a large set that contains all the sets which we are considering in a particular situation.
For example, suppose we are considering the set of Honda cars in a society say set A, and let set B is the group of Red car in the same society then the set of all the cars in that society is the universal set as it contains the values of both the sets, set A and set B in consideration.
The image representing the Universal set is discussed below,

Subset
Subset is actually a set of values that is contained inside another set i.e. we can say that set B is the subset of set A if all the values of set B are contained in set A.
For example, if we take N as the set of all the natural numbers and W as the set of all whole numbers then,
- N = Set of all Natural Numbers
- W = set of all Whole Numbers
We can say that N is a subset of W as all the values of set N are contained in set W i.e.,N ⊆ W
We use Venn diagrams to easily represent a subset of a set. The images discussing the subset of a set are given below,

Venn Diagram Symbols
In order to draw a Venn diagram, first, understand the type of symbols used in sets. Sets can be easily represented on the Venn diagram and the parameters are easily taken out from the diagram itself. We use various types of symbols in drawing Venn diagrams, some of the most important types of symbols used in drawing Venn diagrams are,
|
Venn Diagram Symbols
|
Name of the Symbol
|
Description
|
|
∪
|
Union Symbol
|
The union symbol is used for taking the union of two or more sets.
|
|
∩
|
Intersection Symbol
|
The intersection symbol is used for taking the intersection of two or more sets.
|
|
A’ or Ac
|
Compliment Symbol
|
The complement symbol is used for taking the complement of a set.
|
How to Draw a Venn Diagram?
The above symbols are used while drawing and showing the relationship among sets. In order to draw a Venn diagram.
Step 1: Start by drawing a Rectangle showing the Universal Set.

Step 2: According to the number of sets given and the relationship between/among them, draw different circles representing different Sets.

Step 3: Find the intersection or union of the set using the condition given.

Learn about, Representation of a Set
Venn Diagram for Sets Operations
There are different operations that can be done on sets in order to find the possible unknown parameter, for example, if two sets have something in common, their intersection is possible. The basic operations performed on the set are,
Let’s look at these set operations and how they look on the Venn diagram.
Venn Diagram of Union of Sets
The Union of two or more two sets represents the data of the sets without repeating the same data more than once, it is shown with the symbol ⇢∪.
n(A∪ B) = {a: a∈ A OR a∈ B}

Venn Diagram of Intersection of Sets
The intersection of two or more two sets means extracting only the amount of data that is common between/among the sets. The symbol used for the intersection⇢ ∩.
n(A∩ B)= {a: a∈ A and a∈ B}

Venn Diagram of Complement of a Set
Complementing a set means finding the value of the data present in the Universal set other than the data of the set.
n(A’) = U- n(A)

Venn Diagram of Difference of Set
Suppose we take two sets, Set A and Set B then their difference is given as A – B. This difference represents all the values of set A which are not present in set B.
For example, if we take Set A = {1, 2, 3, 4, 5, 6} and set B = {2, 4, 6, 8} then A- B = {1, 3, 5}.
In the Venn diagram, we represent the A – B as the area of set A which is not intersecting with set B.
Types of Venn Diagrams
There are various types of Venn diagrams that are widely used in Mathematics and other related fields. The various types of Venn diagrams are categorized based on the number of sets involved or circles involved in the Universal set.
- Two-set Venn diagram
- Three-set Venn diagram
- Four-set Venn diagram
- Five-set Venn diagram
Venn Diagram for Three Sets
We can represent three sets easily using the Venn Diagram. Their representation is done by three overlapping circles. Suppose we take three sets of Set A of the people who play cricket. Set B of the people who are graduates and Set C of the people who are 18 years and above of the age.
Then the Venn diagram representing the above three sets is drawn using three circles and taking their intersection wherever required.
Representation of a Three-Set Venn diagram
We can represent the intersection of three sets using the Venn diagram. The below image represents the intersection of three sets.

We can find the various parameters using the above Venn diagram.
Suppose we have to find,
- No of graduates who play cricket it is given by B⋂C
- No of graduates who play cricket and are at least 18 years old is given by A⋂B⋂C, etc.
We use various formulas of the set to find various parameters of the sets.
Let’s take two sets, set A and set B then the various formulas of the sets are,
n(A U B) = n(A) + n(B) – n (A ⋂ B)
Where,
- n(A) represents the number of elements in set A,
- n(B) represents the number of elements in set B,
- n(A U B) represent the number of elements in A U B, and
- n(A ⋂ B) represent the number of elements in A ⋂ B
Similarly, for three sets, Set A, Set B, and Set C we get,
- n (A U B U C) = n(A) + n(B) + n(C) – n(A ⋂ B) – n(B ⋂ C) – n(C ⋂ A) + n(A ⋂ B ⋂ C)
We can understand these formulas with the help of the example discussed below,
Example: In a class of 40 students, 18 like Mathematics, 16 like Science, and 10 like both Mathematics and Science. Then find the students who like either Mathematics or Science.
Solution:
Let A be the set of students who like Mathematics and B be the set of students who like Science, then
n(A) = 18,
n(B) = 16, and
n(A ⋂ B) = 10
Now to find the number of students who like either Mathematics or Science i.e. n(A U B) we use the above formula.
n(A U B) = n(A) + n(B) – n (A ⋂ B)
⇒ n(A U B) = 18 + 16 – 10
⇒ n(A U B) = 24
Uses / Applications of Venn Diagram
Venn diagrams have various use cases such as solving various problems and representing the data in an easy-to-understand format. Various uses of the Venn diagrams are,
- The relation between various sets and their operations can be easily achieved using Venn diagrams.
- Venn diagrams are used for explaining large data sets in a very easy way.
- Venn diagrams are used for logic building and finding the solution to complex data problems.
- Venn diagrams are used to solve problems based on various analogies.
- Analysts use Venn diagrams to represent complex data in easily understandable ways, etc.
Read in Detail: Applications of Venn Diagrams
People Also Read:
Solved Questions on Venn Diagram
Example 1: Set A= {1, 2, 3, 4, 5} and U= {1, 2, 3, 4, 5, 6, 7, 8, 9, 10}.
Represent A’ or Ac on the Venn diagram.
Solution:
Venn Diagram for A’

Example 2: In a Group of people, 50 people either speak Hindi or English, 10 prefer speaking both Hindi and English, 20 prefer only English. How many people prefer speaking Hindi? Explain both by formula and by Venn diagram.
Solution:
According to formula,
n(H∪E) = n(H) + n(E) – n(H∩E)
Both English and Hindi speakers, n(H∩E) = 10
English speakers, n(E)= 20
Either Hindi or English, n(H∪E)= 50
50= 20+ n(H) – 10
n(H)= 50 – 10
n(H)= 40
From Venn Diagram,

Example 3: In a Class, Students like to play these games- Football, Cricket, and Volleyball. 5 students Play all 3 games, 20 play Football, 30 play Volleyball, and 40 play Cricket. 10 play both cricket and volleyball, 12 play both football and cricket, 9 play both football and volleyball. How many students are present in the class?
Solution:
n(F∪ C∪ V)= n(F)+ n(C)+ n(V) – n(F∩C) – n(F∩V) – n(C∩V)+ n(F∩ C∩ V)
n(F∪ C∪ V)= 20+ 30+ 40- 10-12-9+5
n(F∪ C∪ V)= 64
There are 64 Students in the class.
Example 4: Represent the above information with the help of a Venn diagram showing the amount of data present in each set.
Solution:
The above information should look something like this on Venn diagram,

Example 5: Below given Venn diagram has all the sufficient information required to show the data of all the sets possible. Observe the diagram carefully then answer the following.
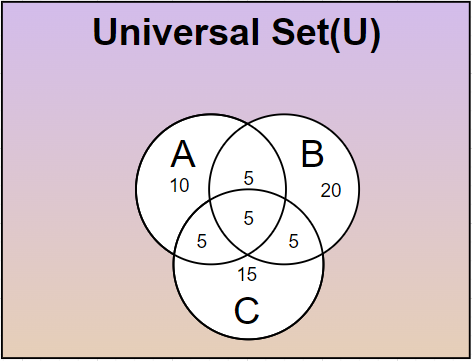
- What is the value of n(A∩ B∩ C)?
- What is the value of n(C)?
- What is the value of n(B ∩ A)?
- What is the value of n(A∪ B∪ C)?
- What is the value of n(B’)?
Solution:
Observing the Venn diagram, the above questions can be easily answered,
1. n(A ∩ B∩ C)= 5
2. n(C)= 15+ 5+5+5= 30
3. n( B∩A)= 5+5= 10
4. n(A∪ B∪ C)= 15+ 20+ 10+ 5+ 5+ 5+ 5= 65
5. n(B’)= U- n(B)= 100- (20+ 5+ 5+ 5)= 100- 35= 65
Venn Diagrams Questions
Q1: Consider two sets, A and B, where A represents fruits and B represents vegetables. Set A contains apples, bananas, and grapes, while set B contains carrots, lettuce, and apples. Draw a Venn diagram to represent these sets. How many items are only in the fruit category?
Q2: In a small neighborhood, 10 households have dogs, 7 have cats, and 3 households have both dogs and cats. How many households have at least one kind of pet? Draw a Venn diagram to represent this situation.
Q3: In a sports club, 120 members play tennis, 150 play badminton, and 50 play both tennis and badminton. How many members play either tennis or badminton? Create a Venn diagram to help you answer.
Summary – Venn Diagram
Venn diagrams, conceptualized by the English logician John Venn in the 1880s, serve as a pictorial representation of the logical relationships among various sets. By utilizing overlapping circles within a rectangle that represents the universal set, Venn diagrams visually demonstrate how sets intersect, differ, and relate to each other, with each circle symbolizing a different set. The overlapping regions depict common elements between sets, while non-overlapping areas show elements unique to each set. These diagrams are instrumental in categorizing data into distinct groups or subsets, facilitating comparison, and identifying similarities and differences among the data sets. They simplify complex data analysis by allowing for the graphical representation of set operations such as union, intersection, complement, and difference. Venn diagrams are applied across various fields for problem-solving, data presentation, and logical reasoning, making them a versatile tool for educators, students, and professionals alike.
FAQs on Venn Diagrams
What is a Venn Diagram in Mathematics?
Venn diagrams are important ways to represent complex logical relations. They were first implemented by the famous mathematician John Venn. They are used to represent the relation between various sets.
How to Read a Venn Diagram?
We can read the Venn diagram with the help of the following steps,
- Observe all the circles in the entire diagram as they represent various sets of data.
- Every circle in the diagram represent a particular data set.
- These circles are overlapped according to various conditions present.
- Study the circles and their interaction to identify various data in the diagram
What is A ∩ B Venn Diagram?
A ∩ B signifies the common element between set A and set b and it is read as A intersection B. In Venn, diagram set A is represented using a circle and similarly set b is represented using another circle then their intersection A ∩ B is represented by the overlapping of the circle of set A and set B.
What are the Different types of Venn diagrams?
Different types of Venn diagrams are,
- Two-set Venn diagram
- Three-set Venn diagram
- Four-set Venn diagram
- Five-set Venn diagram
Who Invented Venn diagram?
The credit for introducing Venn diagram goes to the famous English mathematician John Venn. He was the first to propose the use of the Venn diagram in his paper in 1880.
What is ∩ in a Venn Diagram?
In a Venn Diagram, the symbol ∩ represents the intersection, which indicates the portion that is common to both sets.
What are the Types of Venn Diagram?
Venn diagrams come in various types based on the number of sets they represent. The different types include:
- Two-set Venn diagram
- Three-set Venn diagram
- Four-set Venn diagram
- Five-set Venn diagram
What is Venn Diagram is Used for?
A Venn diagram is a visual tool used in logic theory and set theory to show the relationship between different sets or data.
Like Article
Suggest improvement
Share your thoughts in the comments
Please Login to comment...