Using pandas crosstab to create a bar plot
Last Updated :
26 Oct, 2022
In this article, we will discuss how to create a bar plot by using pandas crosstab in Python. First Lets us know more about the crosstab, It is a simple cross-tabulation of two or more variables.
What is cross-tabulation?
It is a simple cross-tabulation that help us to understand the relationship between two or more variable. It will give a clear understanding of the data and makes analysis easier.
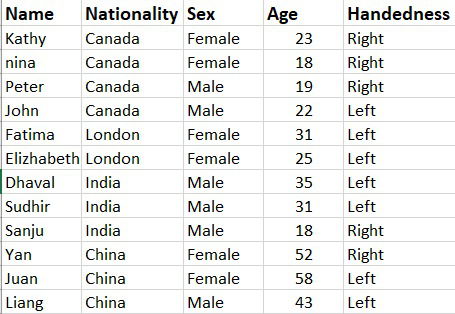
Let us take an example if we take a data set of Handedness of people which includes peoples nationality, sex, age, and name. Suppose if we want to analyze the relationship between nationality and handedness of the peoples. Crosstab gives you the relationship between them.
Crosstab using pandas
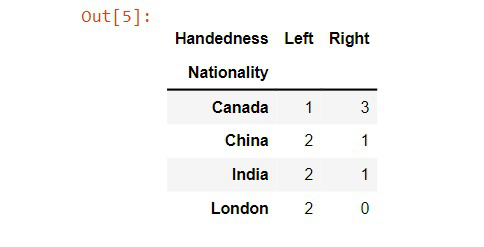
Before creating the barplot we should create cross-tabulation using pandas.
Syntax: pandas.crosstab(index, columns, values=None, rownames=None, colnames=None, aggfunc=None, margins=False, margins_name=’All’, dropna=True, normalize=False
Code:
Python
import pandas as pd
df = pd.read_csv('Data.csv')
crosstb = pd.crosstab(df.Nationality, df.Handedness)
|
Output:
Creating bar plots
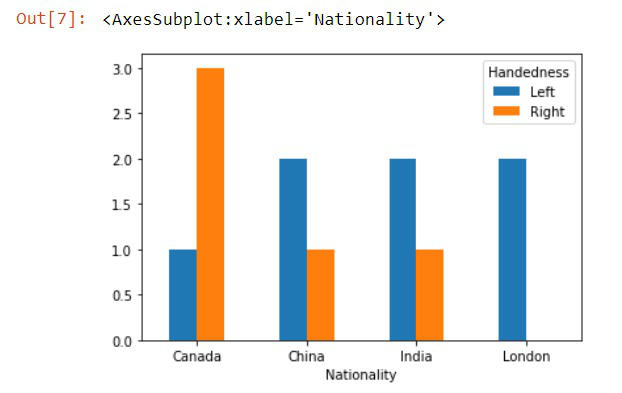
Bar graphs are most used to compare between different groups or to track changes over time. Using bar plots to the crosstab is one of the efficient ways to conclude the crosstab and analyze them even better.
Syntax: DataFrame.plot.bar(x=None, y=None, **kwargs)
Code:
Python3
import pandas as pd
df = pd.read_csv('Data.csv')
crosstb = pd.crosstab(df.Nationality, df.Handedness)
barplot = crosstb.plot.bar(rot=0)
|
Output:
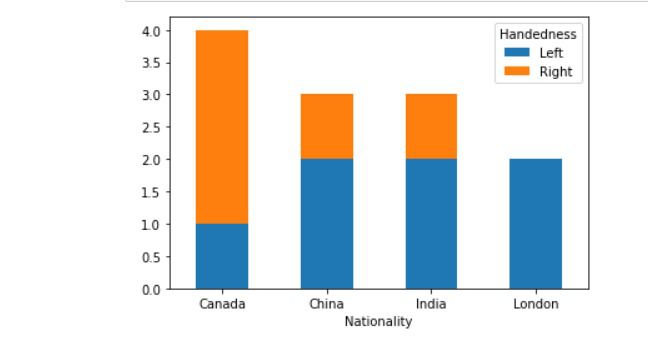
Stacked barplot
Here we will create a stacked barplot through dataframe by passing the stacked parameter as True.
Dataframe.plot(kind=”bar”, stacked = True, rot=0)
Code:
Python
import pandas as pd
df = pd.read_csv('Data.csv')
crosstb = pd.crosstab(df.Nationality, df.Handedness)
pl = crosstb.plot(kind="bar", stacked=True, rot=0)
|
Output:
Creating bar plot using more than two variables from the crosstab
In the above example, we found the relationship between nationality and the handedness of the people. We can also create a crosstab with more than two values. We will implement this in the following example.
Python3
import pandas as pd
df = pd.read_csv('Data.csv')
crosstb = pd.crosstab(df.Sex, [df.Nationality,
df.Handedness])
a = crosstb.plot(kind='bar', rot=0)
a.legend(title='Handedness', bbox_to_anchor=(1, 1.02),
loc='upper left')
|
Output:

Like Article
Suggest improvement
Share your thoughts in the comments
Please Login to comment...