State Machine Diagrams | Unified Modeling Language (UML)
Last Updated :
15 Jan, 2024
A State Machine Diagram is used to represent the condition of the system or part of the system at finite instances of time. It’s a behavioral diagram and it represents the behavior using finite state transitions.

Important Topics for the State Machine Diagrams
1. What is a State Machine Diagram?
A state diagram is used to represent the condition of the system or part of the system at finite instances of time. It’s a
behavioral diagram and it represents the behavior using finite state transitions.
- State Machine diagrams are also referred to as State Machines Diagrams and State-Chart Diagrams.
- These terms are often used interchangeably. So simply, a state machine diagram is used to model the dynamic behavior of a class in response to time and changing external stimuli.
- We can say that each and every class has a state but we don’t model every class using State Machine diagrams.
- We prefer to model the states with three or more states.
Let’s understand State Machine Diagram with the help of an example:
Example:

The State Machine Diagram above shows the different states in which the verification sub-system or class exist for a particular system.
2. Basic components and notations of a State Machine diagram
2.1. Initial state
We use a black filled circle represent the initial state of a System or a Class.
.jpg)
2.2. Transition
We use a solid arrow to represent the transition or change of control from one state to another. The arrow is labelled with the event which causes the change in state.

2.3. State
We use a rounded rectangle to represent a state. A state represents the conditions or circumstances of an object of a class at an instant of time.

2.4. Fork
We use a rounded solid rectangular bar to represent a Fork notation with incoming arrow from the parent state and outgoing arrows towards the newly created states. We use the fork notation to represent a state splitting into two or more concurrent states.
.jpg)
2.5. Join
We use a rounded solid rectangular bar to represent a Join notation with incoming arrows from the joining states and outgoing arrow towards the common goal state. We use the join notation when two or more states concurrently converge into one on the occurrence of an event or events.
.jpg)
2.6. Self transition
We use a solid arrow pointing back to the state itself to represent a self transition. There might be scenarios when the state of the object does not change upon the occurrence of an event. We use self transitions to represent such cases.

2.7. Composite state
We use a rounded rectangle to represent a composite state also. We represent a state with internal activities using a composite state.
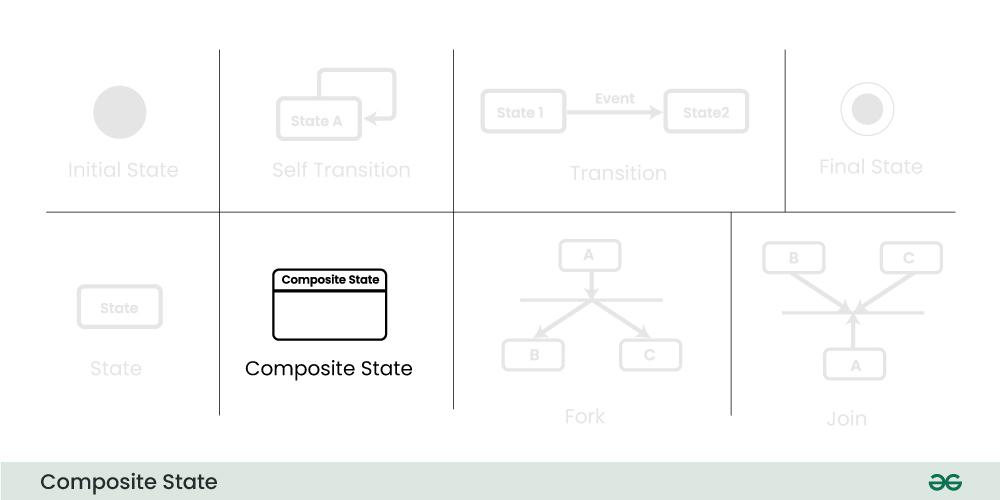
2.8. Final State
We use a filled circle within a circle notation to represent the final state in a state machine diagram.
.jpg)
3. How to draw a State Machine diagram in UML?
.jpg)
Below are the steps of how to draw the State Machine Diagram in UML:
Step1. Identify the System:
- Understand what your diagram is representing.
- Whether it’s a machine, a process, or any object, know what different situations or conditions it might go through.
Step2. Identify Initial and Final States:
- Figure out where your system starts (initial state) and where it ends (final state).
- These are like the beginning and the end points of your system’s journey.
Step3. Identify Possible States:
- Think about all the different situations your system can be in.
- These are like the various phases or conditions it experiences.
- Use boundary values to guide you in defining these states.
Step4. Label Triggering Events:
- Understand what causes your system to move from one state to another.
- These causes or conditions are the events.
- Label each transition with what makes it happen.
Step5. Draw the Diagram with appropriate notations:
- Now, take all this information and draw it out.
- Use rectangles for states, arrows for transitions, and circles or rounded rectangles for initial and final states.
- Be sure to connect everything in a way that makes sense.
Let’s understand State Machine diagram with the help of an example, ie for an online order :

The UML diagrams we draw depend on the system we aim to represent. Here is just an example of how an online ordering system might look like :
- On the event of an order being received, we transit from our initial state to Unprocessed order state.
- The unprocessed order is then checked.
- If the order is rejected, we transit to the Rejected Order state.
- If the order is accepted and we have the items available we transit to the fulfilled order state.
- However if the items are not available we transit to the Pending Order state.
- After the order is fulfilled, we transit to the final state. In this example, we merge the two states i.e. Fulfilled order and Rejected order into one final state.
Note: Here we could have also treated fulfilled order and rejected order as final states separately.
4. UseCases of State Machine Diagram
- State Machine Diagrams are particularly useful for modeling and visualizing the dynamic behavior of a system.
- They showcase how a system responds to events and transitions between different states.
- We use it to state the events responsible for change in state (we do not show what processes cause those events).
- Objects go through different states during their existence, and these diagrams help in illustrating these states and the transitions between them.
- In embedded systems, where hardware interacts with software to perform tasks, State Machine Diagrams are valuable for representing the control logic and behavior of the system.
5. What are the Differences between a State Machine Diagram and a Flowchart?
What is a Flowchart?
An algorithm is like a set of clear instructions to solve a problem, and a flowchart is a picture that shows those instructions.
- When we’re writing computer programs, a flowchart helps us map out the steps of the algorithm to solve the problem.
- Non programmers use Flow charts to model workflows.
- We can call a flowchart a primitive version of an activity diagram.
- Business processes where decision making is involved is expressed using a flow chart.
Example:
A manufacturer uses a flow chart to explain and illustrate how a particular product is manufactured.
State Machine Diagram VS Flow Chart?
|
An State Machine Diagram is associated with the UML(Unified Modelling Language)
|
A Flow Chart is associated with the programming.
|
|
The basic purpose of a state machine diagram is to portray various changes in state of the class and not the processes or commands causing the changes.
|
A flowchart on the other hand portrays the processes or commands that on execution change the state of class or an object of the class.
|
|
Primarily used for systems, emphasizing their states and transitions.
|
Often used for processes, procedures, or algorithms involving actions and decisions.
|
6. Conclusion
State Machine Diagrams in UML are like pictures that tell us how things change in a system. They show the different situations a system can be in and how it moves between them. These diagrams help us understand what events make these changes happen. Whether it’s for designing software or explaining how something works, State Machine Diagrams are like visual guides that make it easier to see and understand how a system behaves in different situations.
Like Article
Suggest improvement
Share your thoughts in the comments
Please Login to comment...