Two-Tailed Test of Population Proportion in R
Last Updated :
02 Jun, 2022
A statistical hypothesis test is putting your assumption about population parameters to test and checking if your assumption is still valid by computing and comparing the population parameters with test statistics.
The conventional steps that are followed while formulating the hypothesis test, are listed as follows
- State null hypothesis (Ho) and alternate hypothesis (Ha)
- Collect a relevant sample of data to test the hypothesis.
- Choose a significance level for the hypothesis test.
- Perform an appropriate statistical test.
- Based on test statistics and p-value decide whether to reject or fail to reject your null hypothesis.
Generally, hypothesis testing is performed to estimate the population mean and population proportion, in this article let us discuss how to perform a two-tailed population proportion test. A two-tailed test in general is a method in which the critical area of a distribution is two-sided (both extremes) and tests whether a sample is greater than or less than a specific range of values.
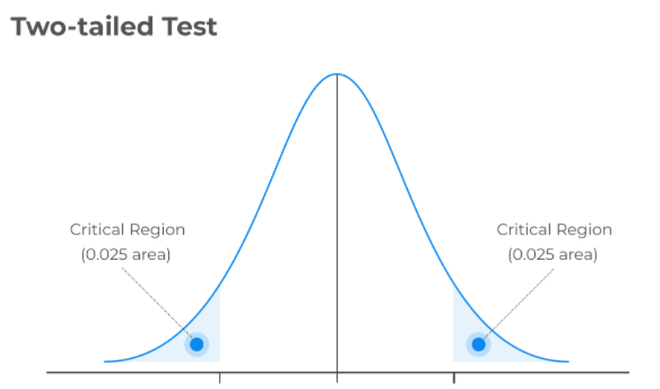
Two-tailed test with alpha = 0.05, (0.025 on either side)
Hypothesis testing for proportions involves measuring two outcomes, like success or failure, true or false, good or bad, and so on in a defined set of trials. The probability of getting success or failure should be the same throughout the trial.
Let us take a more realistic example, today cybercrime is a major threat online, so let us consider a credit card fraudulent transaction case. Assume a popular banking firm has conducted a study for several years and came up with standard reference values of the probability of any transaction being fraudulent is 5% which conversely means that the probability of any transaction to be non-fraudulent is 9%. So here the probability of success is 0.95 and failure is 0.05 and assume these numbers are going to be constant for any credit card transaction.
One fine day a competitive banking firm wishes to challenge these numbers and wanted to conduct a hypothesis test to prove the probability of fraudulent transaction is not equal to 2%. The competitive banking firm samples 25 random transactions and found 2 in 25 transactions found to be fraudulent. . Let us frame the population proportion hypothesis based on the above problem.
Null Hypothesis: The probability of any transaction being fraudulent is 5% p = po (Here, po = 0.05)
Alternate Hypothesis: The probability of any transaction being fraudulent is not equal to 5% p != po
alpha: 0.05
Let us define the test statistic as follows

where,
 : Sample Proportion
- p = population proportion
- n = sample size
Example:
Let us compute the test statistic function using R as shown below
R
pbar = 2/25
p0 = 0.05
n = 25
z = (pbar-p0)/sqrt(p0*(1-p0)/n)
z
|
Output:
z = 0.688247201611683
Now let us compute the critical values at a 0.05 significance level.
R
alpha = .05
z.half.alpha = qnorm(1-alpha/2)
c(-z.half.alpha, z.half.alpha)
|
Output:
-1.95996398454005, 1.95996398454005
The computed test statistic 0.68824720 lies between the critical values -1.9600 and 1.9600. Hence, at the .05 significance level, we fail to reject the null hypothesis. In other words, we don’t have enough evidence to conclude that the probability of a fraudulent transaction is not equal to 5%.
Like Article
Suggest improvement
Share your thoughts in the comments
Please Login to comment...