Translation of objects in computer graphics
Last Updated :
23 Apr, 2024
In computer graphics, we have seen how to draw some basic figures like line and circles. In this post we will discuss on basics of an important operation in computer graphics as well as 2-D geometry, which is transformation.
In computer graphics, transformation of the coordinates consists of three major processes:
- Translation
- Rotation
- Scaling
In this post we will discuss about translation only.
What is translation?
A translation process moves every point a constant distance in a specified direction. It can be described as a rigid motion. A translation can also be interpreted as the addition of a constant vector to every point, or as shifting the origin of the coordinate system.
Suppose, If point (X, Y) is to be translated by amount Dx and Dy to a new location (X’, Y’) then new coordinates can be obtained by adding Dx to X and Dy to Y as:
X' = Dx + X
Y' = Dy + Y

or P' = T + P where

P' = (X', Y'),
T = (Dx, Dy ),
P = (X, Y)
Here, P(X, Y) is the original point. T(Dx, Dy) is the translation factor, i.e. the amount by which the point will be translated. P'(X’, Y’) is the coordinates of point P after translation.
Examples:
Input : P[] = {5, 6}, T = {1, 1}
Output : P'[] = {6, 7}

Input : P[] = {8, 6}, T = {-1, -1}
Output : P'[] = {7, 5}
Whenever we perform translation of any object we simply translate its each and every point. Some of basic objects along with their translation can be drawn as:
Point Translation P(X, Y) : Here we only translate the x and y coordinates of given point as per given translation factor dx and dy respectively.
Below is the C++ program to translate a point:
CPP
#include <iostream>
#include <graphics.h>

// function to translate point
void translatePoint(int P[], int T[]) {
    /* init graph and putpixel are used for
       representing coordinates through graphical
       functions
    */
    int gd = DETECT, gm, errorcode;
    initgraph(&gd, &gm, "c:\\tc\\bgi");

    std::cout << "Original Coordinates: " << P[0] << "," << P[1];

    putpixel(P[0], P[1], 1);

    // calculating translated coordinates
    P[0] = P[0] + T[0];
    P[1] = P[1] + T[1];

    std::cout << "\nTranslated Coordinates: " << P[0] << "," << P[1];

    // Draw new coordinates
    putpixel(P[0], P[1], 3);
    closegraph();
}

// driver program
int main() {
    int P[2] = {5, 8}; // coordinates of point
    int T[] = {2, 1};  // translation factor
    translatePoint(P, T);
    return 0;
}
public class Translation {
    public static void main(String[] args) {
        int[] P = {5, 8}; // coordinates of point
        int[] T = {2, 1}; // translation factor
        translatePoint(P, T);
    }

    // function to translate point
    static void translatePoint(int[] P, int[] T) {
        // Original point
        System.out.println("Original Coordinates: (" + P[0] + ", " + P[1] + ")");

        // Calculate translated coordinates
        P[0] += T[0];
        P[1] += T[1];

        // Translated point
        System.out.println("Translated Coordinates: (" + P[0] + ", " + P[1] + ")");
    }
}
Output:
Original Coordinates : 5, 8
Translated Coordinates : 7, 9
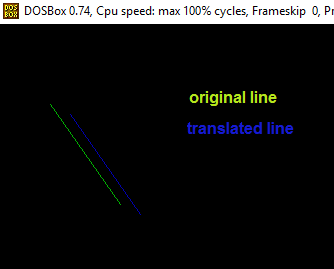
Line Translation: The idea to translate a line is to translate both of the end points of the line by the given translation factor(dx, dy) and then draw a new line with inbuilt graphics function.
Below is the C++ implementation of above idea:
CPP
#include <iostream>
#include <graphics.h>

// function to translate line
void translateLine(int P[][2], int T[]) {
    /* init graph and line() are used for
       representing line through graphical
       functions
    */
    int gd = DETECT, gm, errorcode;
    initgraph(&gd, &gm, "c:\\tc\\bgi");

    // drawing original line using graphics functions
    setcolor(2);
    line(P[0][0], P[0][1], P[1][0], P[1][1]);

    // calculating translated coordinates
    P[0][0] = P[0][0] + T[0];
    P[0][1] = P[0][1] + T[1];
    P[1][0] = P[1][0] + T[0];
    P[1][1] = P[1][1] + T[1];

    // drawing translated line using graphics functions
    setcolor(3);
    line(P[0][0], P[0][1], P[1][0], P[1][1]);
    closegraph();
}

// driver program
int main() {
    int P[2][2] = {{5, 8}, {12, 18}}; // coordinates of points
    int T[] = {2, 1}; // translation factor
    translateLine(P, T);
    return 0;
}
Output:
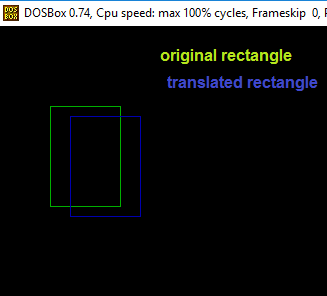
Rectangle Translation : Here we translate the x and y coordinates of both given points A(top left ) and B(bottom right) as per given translation factor dx and dy respectively and then draw a rectangle with inbuilt graphics function
CPP
#include <iostream>
#include <graphics.h>

// Function to translate rectangle
void translateRectangle(int P[][2], int T[]) {
    int gd = DETECT, gm, errorcode;
    initgraph(&gd, &gm, "c:\\tc\\bgi"); // Initialize graphics

    // Original rectangle
    setcolor(2);
    rectangle(P[0][0], P[0][1], P[1][0], P[1][1]);

    // Calculating translated coordinates
    P[0][0] = P[0][0] + T[0];
    P[0][1] = P[0][1] + T[1];
    P[1][0] = P[1][0] + T[0];
    P[1][1] = P[1][1] + T[1];

    // Translated rectangle
    setcolor(3);
    rectangle(P[0][0], P[0][1], P[1][0], P[1][1]);
    delay(5000); // Delay to show the result
    closegraph(); // Close graphics
}

// Driver program
int main() {
    // Rectangle coordinates of top left and bottom right points
    int P[2][2] = {{5, 8}, {12, 18}};
    int T[] = {2, 1}; // Translation factor
    translateRectangle(P, T);
    return 0;
}
# Importing required libraries
from matplotlib import pyplot as plt
from matplotlib.patches import Rectangle

# Function to translate rectangle
def translate_rectangle(P, T):
    # Create a figure and a set of subplots
    fig, ax = plt.subplots()

    # Original rectangle
    # Rectangle((xmin, ymin), width, height)
    original_rectangle = Rectangle((P[0][0], P[0][1]), P[1][0] - P[0][0], P[1][1] - P[0][1], fill=None, edgecolor='r')
    ax.add_patch(original_rectangle)

    # Calculating translated coordinates
    P[0][0] = P[0][0] + T[0]
    P[0][1] = P[0][1] + T[1]
    P[1][0] = P[1][0] + T[0]
    P[1][1] = P[1][1] + T[1]

    # Translated rectangle
    translated_rectangle = Rectangle((P[0][0], P[0][1]), P[1][0] - P[0][0], P[1][1] - P[0][1], fill=None, edgecolor='b')
    ax.add_patch(translated_rectangle)

    # Set limits for x and y axis
    ax.set_xlim([0, 20])
    ax.set_ylim([0, 20])

    # Show the plot with the original and translated rectangle
    plt.show()

# Driver program
if __name__ == "__main__":
    # Coordinates of top left and bottom right points
    P = [[5, 8], [12, 18]]
    # Translation factor
    T = [2, 1]
    translate_rectangle(P, T)
Output:
References : http://math.hws.edu/graphicsbook/.
Like Article
Suggest improvement
Share your thoughts in the comments
Please Login to comment...