Tracing memory usage in Linux
Last Updated :
08 Jun, 2023
Memory is a critical resource in computing because its usage affects the performance and stability of a system. It’s necessary to trace the memory usage of the system in order to determine the program that consumes all CPU resources or the program that is responsible for slowing down the activities of the CPU.
Tracing memory usage also becomes necessary to determine the load on the server. Parsing the usage data enables the servers to be able to balance the load and serve the user’s request without slowing down the system. In Linux, there are several ways to trace memory usage, and we are going to discuss them.
Using the `free` command to check memory usage in Linux.
free Displays the amount of memory that is currently available and used by the system (both physical and swapped). free command gathers this data by parsing /proc/meminfo. By default, the amount of memory is displayed in kilobytes.
free
.webp)
free
To display the memory usage in megabytes every 5 seconds, we use the following command. Watch command is used to execute a program periodically.
watch -n 5 free -m
.webp)
watch -n 5 free -m
Using the `vmstat` command to check memory usage in Linux.
vmstat vmstat command is used to display virtual memory statistics of the system. This command reports data about the memory, paging, disk, and CPU activities, etc. The first use of this command returns the data averages since the last reboot. Further users return the data based on sampling periods of long delays.
vmstat
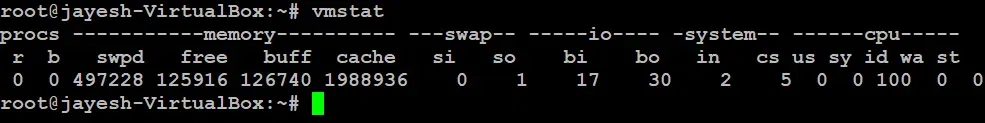
vmstat
To view disk statics
vmstat -d

vmstat -d
Displays the amount of memory used and available.
vmstat -s
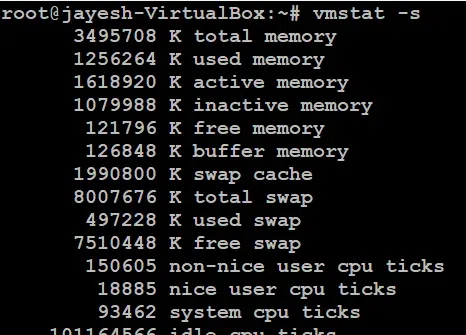
vmstat -s
Using the `top` command to check memory usage in Linux.
top command displays all the currently running processes in the system. This command displays the list of processes and thread currently being handled by the kernel. The top command can also be used to monitor the total amount of memory usage.

top
Thread-mode operation. Displays individual thread that are currently in the system. Without this command option, a summation of all thread in each process is displayed.
top -H

top -H
Using the `/proc/meminfo ` location to check memory usage in Linux.
/proc/meminfo This file contains all the data about the memory usage. It provides the current memory usage details rather than old, stored values.
cat /proc/meminfo

cat /proc/meminfo
Using the `htop ` command to check memory usage in Linux.
htop is an interactive process viewer. This command is similar to top command except that it allows to scroll vertically and horizontally to allows users to view all processes running on the system, along with their full command line as well as viewing them as a process tree, selecting multiple processes and acting on them all at once.
To use htop we need to install it in our system.
sudo apt-get install htop
Now we can use the following command.
htop

htop
Conclusion
In this article we are discussing different methods to trace memory usage in Linux as memory usage is an essential aspect of computing which is used to optimize the performance and stability of a system. We have discussed commands like free, vmstat, top, /proc/meminfo, and htop. By using these commands, we can monitor memory usage and diagnose problems that may occur in a system. Overall, we can say monitoring memory usage in Linux system is important for efficient system management.
Like Article
Suggest improvement
Share your thoughts in the comments
Please Login to comment...